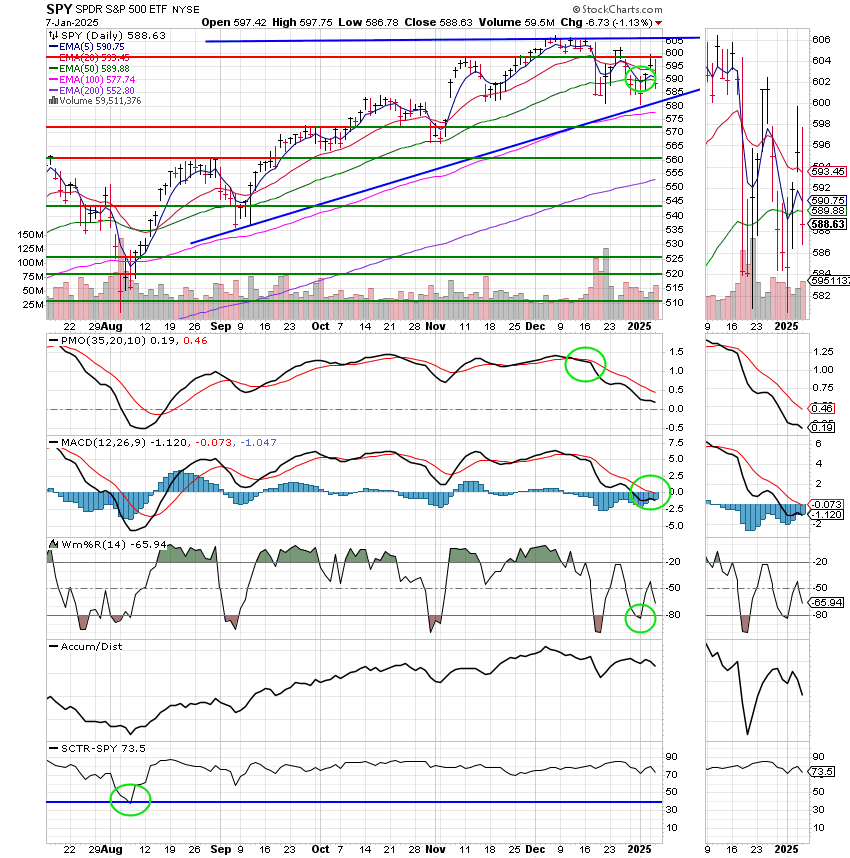
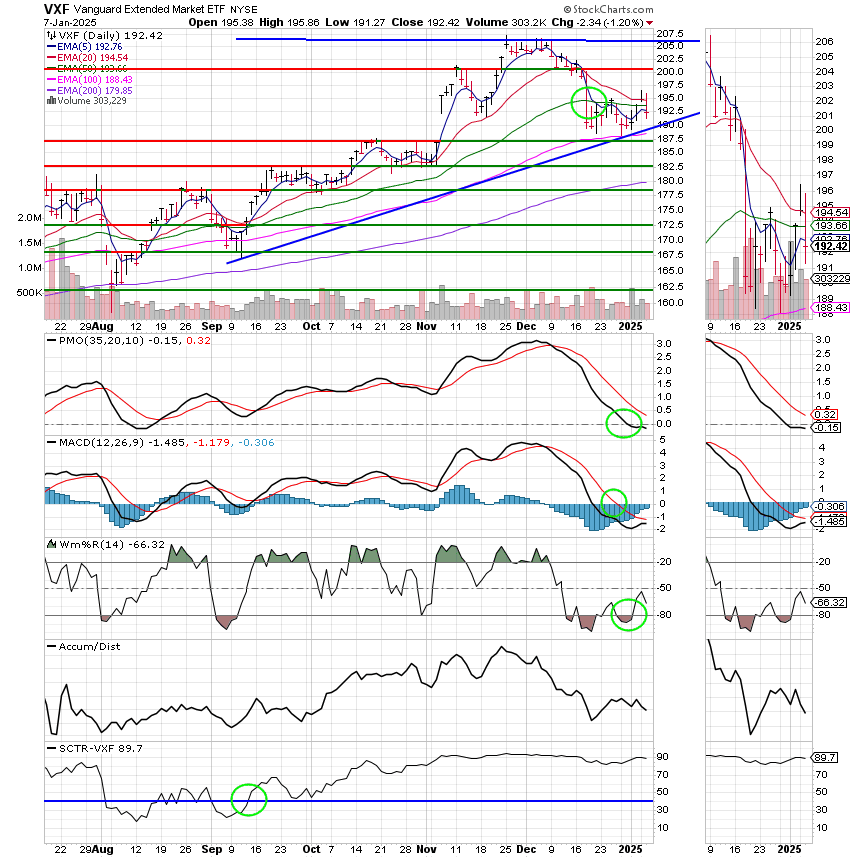
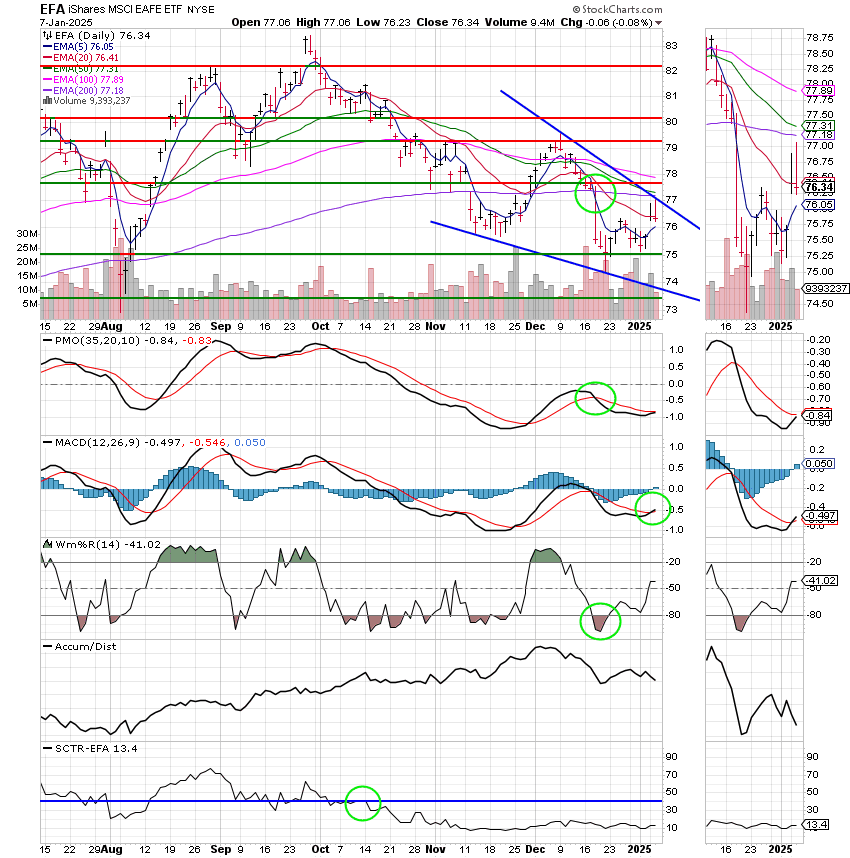
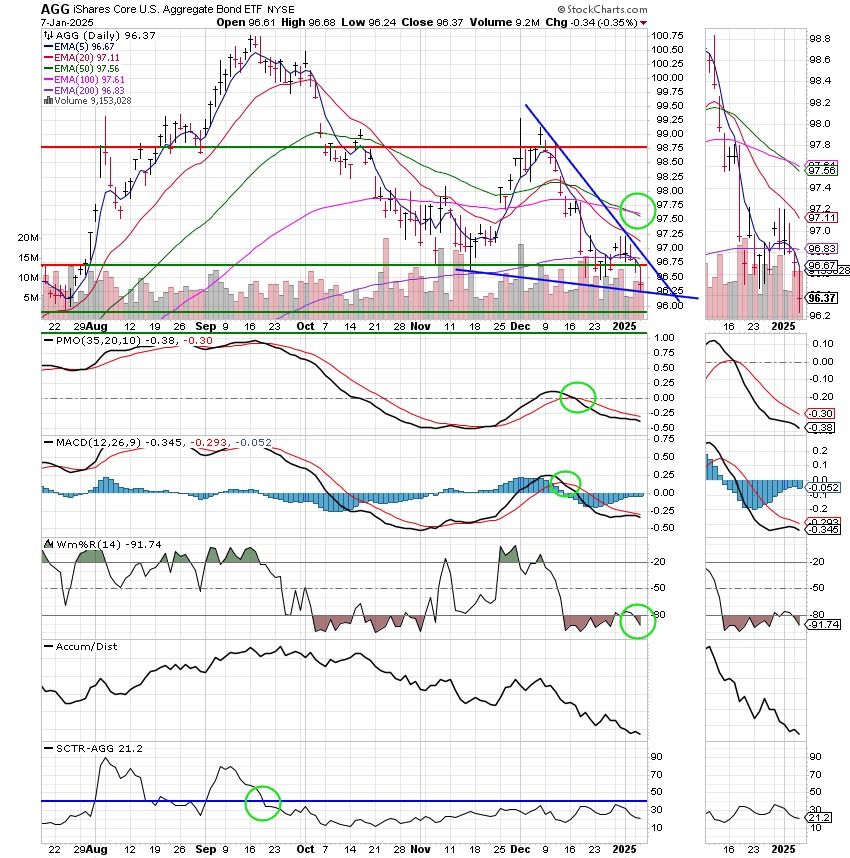
Good Afternoon, My, what a dismal day and I’m not talking about the weather! I’m talking about the major indices being off triple digits. This the the worst day we’ve had in a while. but it comes after a few decent ones so we really can’t complain. The culprit for the selling was a hot report from the service sector. Data released Tuesday by the Institute for Supply Management reflected faster-than-expected growth in the U.S. services sector in December, adding to concerns about stickier inflation. Okay got that, same thing as before….. So are we selling into oblivion? I don’t think so! This report is no different than the others we’ve delt with recently. It’s the result of a healthy economy and a healthy economy is good for corporate profits and that’s ultimately good for the market. Folks, here’s the bottom line. The trend is still up. If you look at the charts for the major indices the 20 EMA is still on top. For those of you that are new to investing that means that the 20 day moving average is higher than the 50 day moving average which is higher than the 1oo day moving average which is higher than the 200 day moving average. When we start seeing things like the 20EMA passing down through the 50 EMA or god f0rbid the 50 EMA passing d0wn the the 200 EMA then I’ll get concerned, but right now there is no reason to be concerned!! By the way that last scenario I described where the 50EMA passes through the 200 EMA on the way down is known as the devils cross. When it passes through the 200 moving higher it’s known as the Golden cross. I’ll let you decide which one is the best. A lot of folks use that metric to define a bear or a bull market. Anyway, my point is that we are in a solid uptrend and it’s still Risk on! One more thing for you rookies. When the 20 EMA is on the bottom and moving lower we often refer to the market as being upside down. Now moving on, the rest of the week will be influenced by the ADP and Department of Labor employment reports which will be on Wednesday and Friday respectively. As long as they meet expectations we will be fine, but if they come in high or low you can expect more selling. Our approach to this type of scenario is always the same. We’ll watch our charts closely for any changes in the trend and react if and when we see them. There’s no reason to panic or overcomplicate things.
The days trading left us with the following results: Our TSP allocation dropped -1.20%. For comparison, the Dow was off -0.42%, the Nasdaq -1.89%, and the S&P 500 -1.13%. So as you can see it was a bad day for the whole market.
Dow falls more than 170 points, Nasdaq loses nearly 2% as Nvidia leads tech sell-off: Live updates
Recent action has generated the following signals: C-Hold, S-Hold, I-Hold, F-Sell. We are currently invested at 100/S. Our allocation is now +2.52% for the year not including the days results. Here are the latest posted results:
| 01/06/25 | Prior Prices | ||||
| Fund | G Fund | F Fund | C Fund | S Fund | I Fund |
| Price | 18.7682 | 19.4336 | 94.4278 | 92.4225 | 42.4842 |
| $ Change | 0.0072 | -0.0158 | 0.5275 | 0.4006 | 0.3763 |
| % Change day | +0.04% | -0.08% | +0.56% | +0.44% | +0.89% |
| % Change week | +0.04% | -0.08% | +0.56% | +0.44% | +0.89% |
| % Change month | +0.07% | -0.23% | +1.61% | +2.52% | +1.40% |
| % Change year | +0.07% | -0.23% | +1.61% | +2.52% | +1.40% |


