Good Evening, Can they or can’t they….that is how the market is trading right now. Can they pass a stimulus bill or can’t they. Can they get people vaccinated or can’t they? Can they stop Covid 19 before new vaccine resistant strains develop or can’t they? Can they get their mind off of partisan politics long enough to do any of the things I already mentioned or can’t they? In the same breadth can they impeach former president Trump and second time or can’t they? How much time will they waste while more important issues go unresolved? Does anyone other than the politicians even care? That’s how the market is trading. Each news release on any of the aforementioned questions increases the volatility of the market just a little more. So it’s certainly a good thing that the market is in a bend but don’t break mode. The charts are still pointing higher and 89% of the companies that have reported so far this quarter have beaten estimates. Despite all the QUESTIONS, these things are what continue to keep the market moving higher and you all know how the market is. The more uncertainty there is, the more downward pressure that builds up. So far it’s nothing the market can’t handle, but it’s definitely worth mentioning and watching. The safety valve popped off just a little today with a slightly negative day. However, unless these folks do something really foolish it will likely be no more than consolidation. As usual we will see what they do on our charts.
The days trading left us with the following results: Our TSP allotment posted a drop of -1.03%. For comparison, the Dow was off -0.07%, the Nasdaq -0.07%, and the S&P 500 -0.15%. The I fund was the only thing in TSP in the green today at +0.15%. Oh well. I’m still extremely thankful for all the good days that God has given in recent weeks.
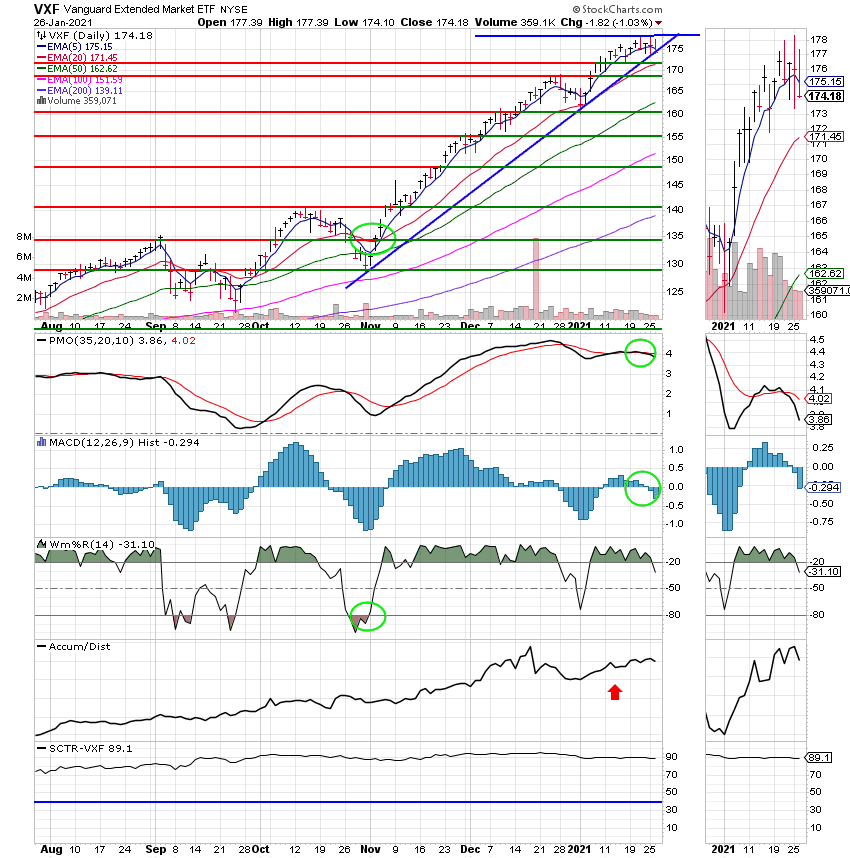
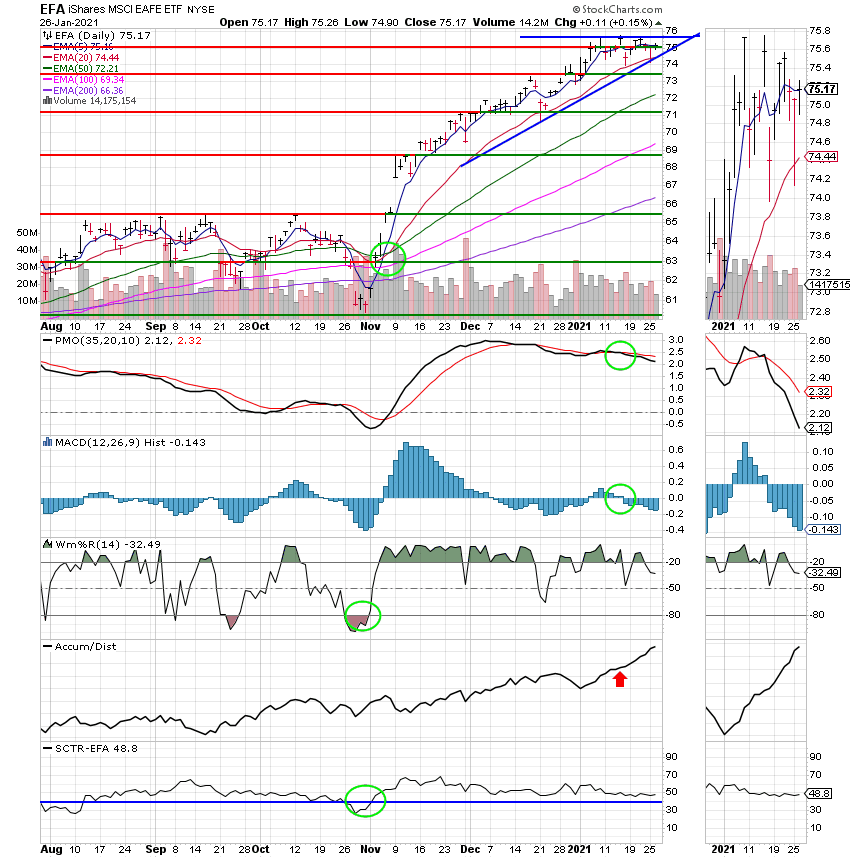
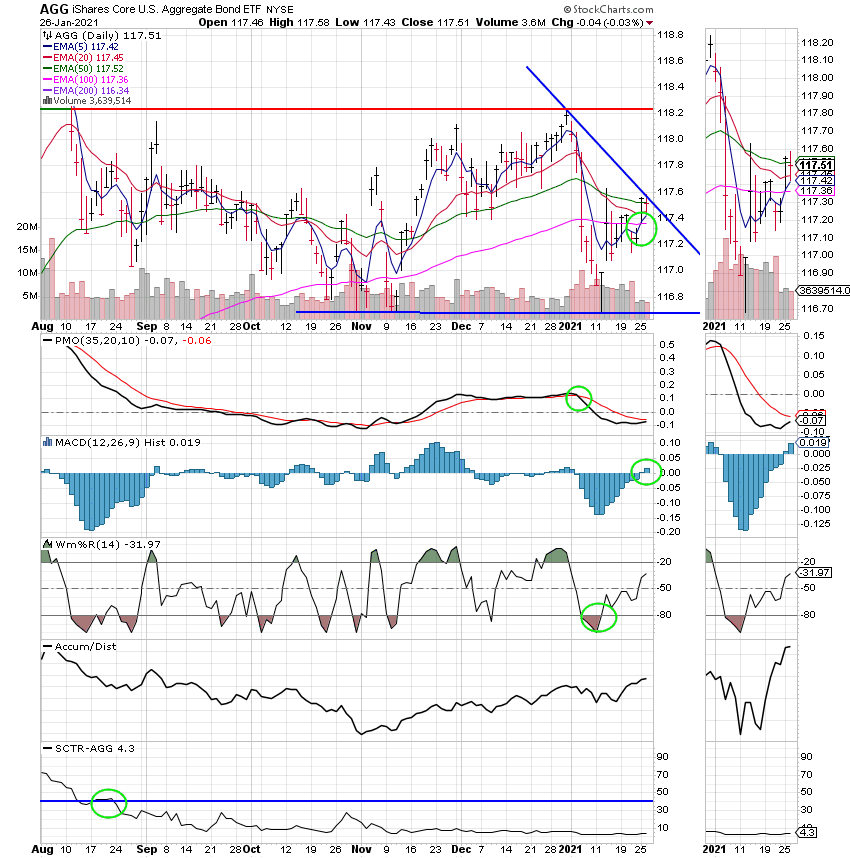
The days action left us with the following signals: C-Buy, S-Buy, I-Buy, F-Hold. We are currently invested at 100/S. Our allocation is now +7.11% on the year not including the days results. Here are the latest posted results:
| 01/25/21 | Prior Prices | ||||
| Fund | G Fund | F Fund | C Fund | S Fund | I Fund |
| Price | 16.5178 | 21.0851 | 57.4356 | 79.4762 | 36.0432 |
| $ Change | 0.0012 | 0.0471 | 0.2073 | -0.1268 | -0.2115 |
| % Change day | +0.01% | +0.22% | +0.36% | -0.16% | -0.58% |
| % Change week | +0.01% | +0.22% | +0.36% | -0.16% | -0.58% |
| % Change month | +0.06% | -0.52% | +2.73% | +7.11% | +1.85% |
| % Change year | +0.06% | -0.52% | +2.73% | +7.11% | +1.85% |
| Fund | L INC | L 2025 | L 2030 | L 2035 | L 2040 |
| Price | 22.429 | 11.3187 | 39.4738 | 11.7976 | 44.4263 |
| $ Change | 0.0023 | -0.0001 | -0.0027 | -0.0011 | -0.0058 |
| % Change day | +0.01% | +0.00% | -0.01% | -0.01% | -0.01% |
| % Change week | +0.01% | +0.00% | -0.01% | -0.01% | -0.01% |
| % Change month | +0.68% | +1.43% | +1.80% | +1.98% | +2.16% |
| % Change year | +0.68% | +1.43% | +1.80% | +1.98% | +2.16% |
| Fund | L 2045 | L 2050 | L 2055 | L 2060 | L 2065 |
| Price | 12.1231 | 26.449 | 12.791 | 12.7911 | 12.7912 |
| $ Change | -0.0020 | -0.0055 | -0.0061 | -0.0061 | -0.0061 |
| % Change day | -0.02% | -0.02% | -0.05% | -0.05% | -0.05% |
| % Change week | -0.02% | -0.02% | -0.05% | -0.05% | -0.05% |
| % Change month | +2.32% | +2.48% | +3.05% | +3.05% | +3.05% |
| % Change year | +2.32% | +2.48% | +3.05% | +3.05% | +3.05% |