Good Evening, And the downtrend continues…. today’s concerns, eh, excuses that the media put forth were a glut in the supply of oil and the test of a hydrogen bomb by North Korea. I’m going to let the technical analyst in me come out. I don’t care what the media reports. They have to come up with some reason why the market did what it did and this was today’s explanation. If you want to know the true story. If you want to know what is happening and you don’t really care why, then you are one of us. You need to watch the charts and react to the action you see. Starting the middle of December our charts started warning us that this market was primed for at least a small pull back. The S and I funds had been generating sell signals and the C fund finally capitulated to the conditions and did the same. The end result of it all was our move to the G Fund. Through this move we were able to close out the year with a small gain and side step the decline so far in 2016. Trust in God and your charts and take everything else with a grain of salt….. What else would you expect to hear from a Christian Technical Analyst?
The days sell off left us with the following results: Our TSP allotment was steady in the G Fund. For comparison, the Dow lost -1.47%, the Nasdaq -1.14%, and the S&P 500 -1.31%. So far it has been a good year to be in the G Fund. I thank God for his guidance!
Wall Street drops to three-month low; China, energy weigh
The days action left us with the following signals: C-Sell, S-Sell, I-Sell, F-Neutral. We are currently invested at 100/G. Our allocation is now +0.03% on the year not including the days results. Here are the latest posted results:
| 01/05/16 | Prior Prices | ||||
| Fund | G Fund | F Fund | C Fund | S Fund | I Fund |
| Price | 14.9199 | 16.9744 | 27.202 | 34.647 | 23.5576 |
| $ Change | 0.0010 | -0.0021 | 0.0548 | 0.0284 | -0.0734 |
| % Change day | +0.01% | -0.01% | +0.20% | +0.08% | -0.31% |
| % Change week | +0.03% | +0.12% | -1.31% | -1.67% | -2.23% |
| % Change month | +0.03% | +0.12% | -1.31% | -1.67% | -2.23% |
| % Change year | +0.03% | +0.12% | -1.31% | -1.67% | -2.23% |
| L INC | L 2020 | L 2030 | L 2040 | L 2050 | |
| Price | 17.7215 | 23.0296 | 24.8022 | 26.2487 | 14.8175 |
| $ Change | 0.0018 | 0.0039 | 0.0050 | 0.0058 | 0.0035 |
| % Change day | +0.01% | +0.02% | +0.02% | +0.02% | +0.02% |
| % Change week | -0.29% | -0.77% | -1.04% | -1.21% | -1.39% |
| % Change month | -0.29% | -0.77% | -1.04% | -1.21% | -1.39% |
| % Change year | -0.29% | -0.77% | -1.04% | -1.21% | -1.39% |
Lets take a look at the charts: (All signals annotated with Green Circles) If you click on the charts they will get bigger!
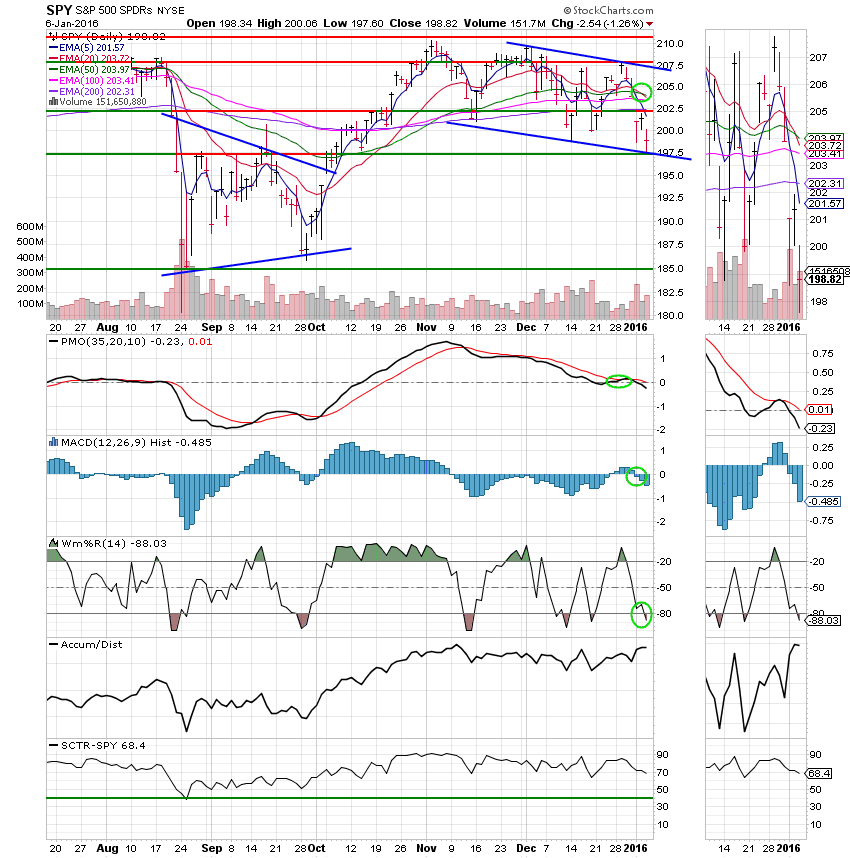
C Fund: The C Fund has generated an overall sell signal as Price, the PMO, ther MACD, and the Williams %R have all moved into negative configurations. The Accum/Dist line indicates that there is still plenty of money to fuel a turnaround. Price bounce off support at 197.50.
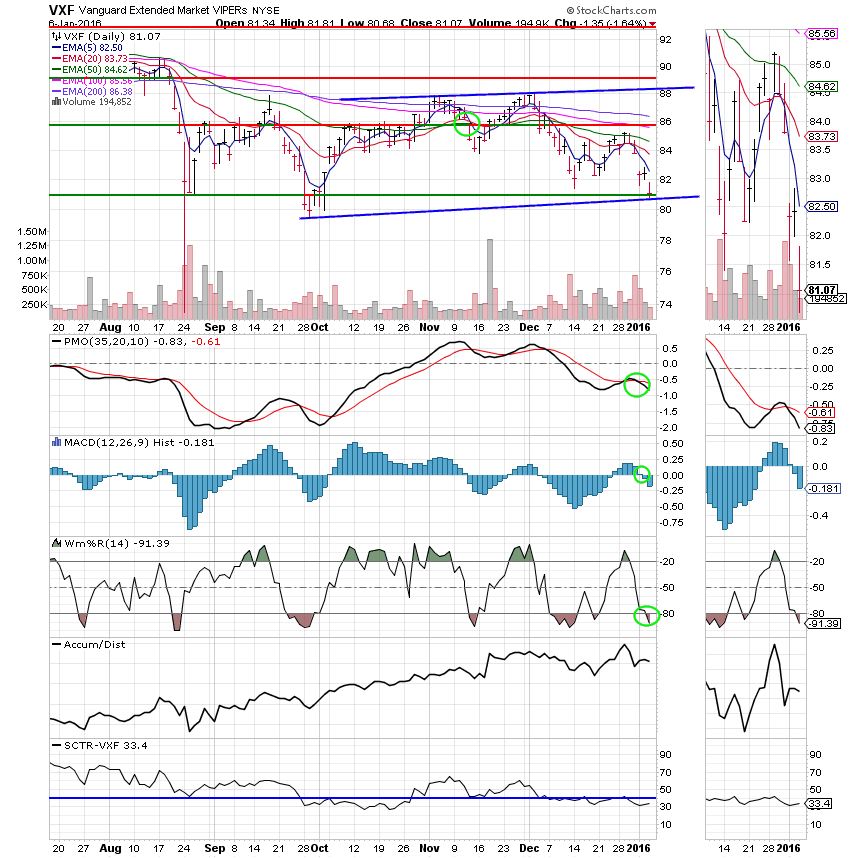
S Fund: All four indicators are in negative configurations for an overall sell signal. The SCTR is only 33.4 indicating that this mid cap blend has been hammered as compared to most of it’s peers….. Support at close to 80.90 was tested today. It is holding for now. Price bounced off the lower trend line which is moving up.
I Fund: A little different story here with support breaking at a little over 57. This ones in a free fall. Could this be an omen of things to come? 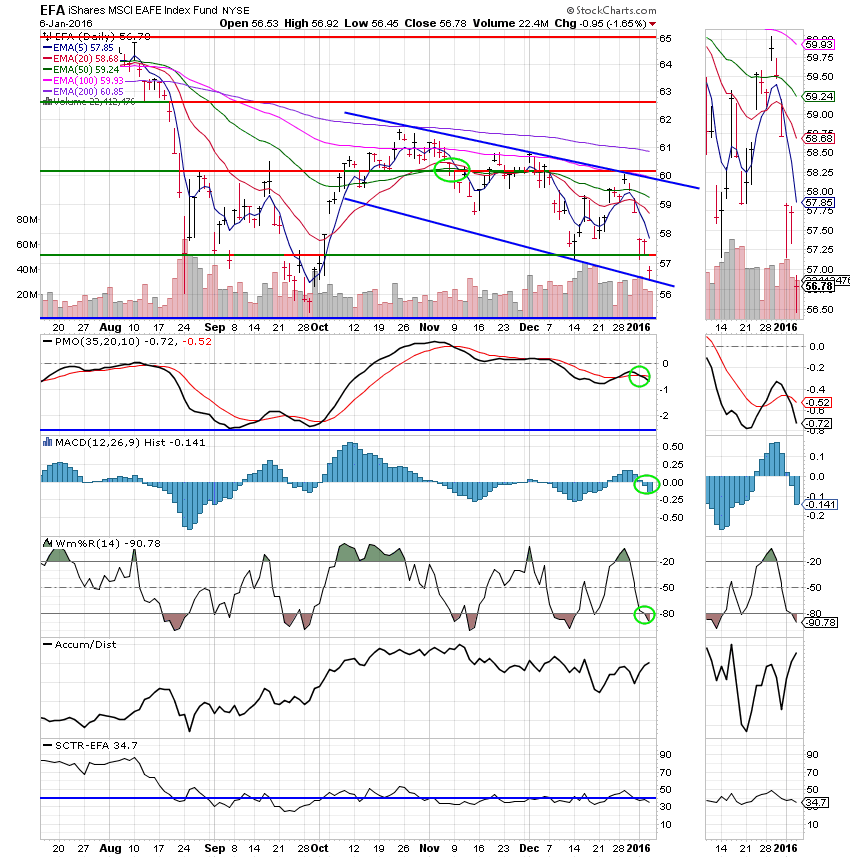
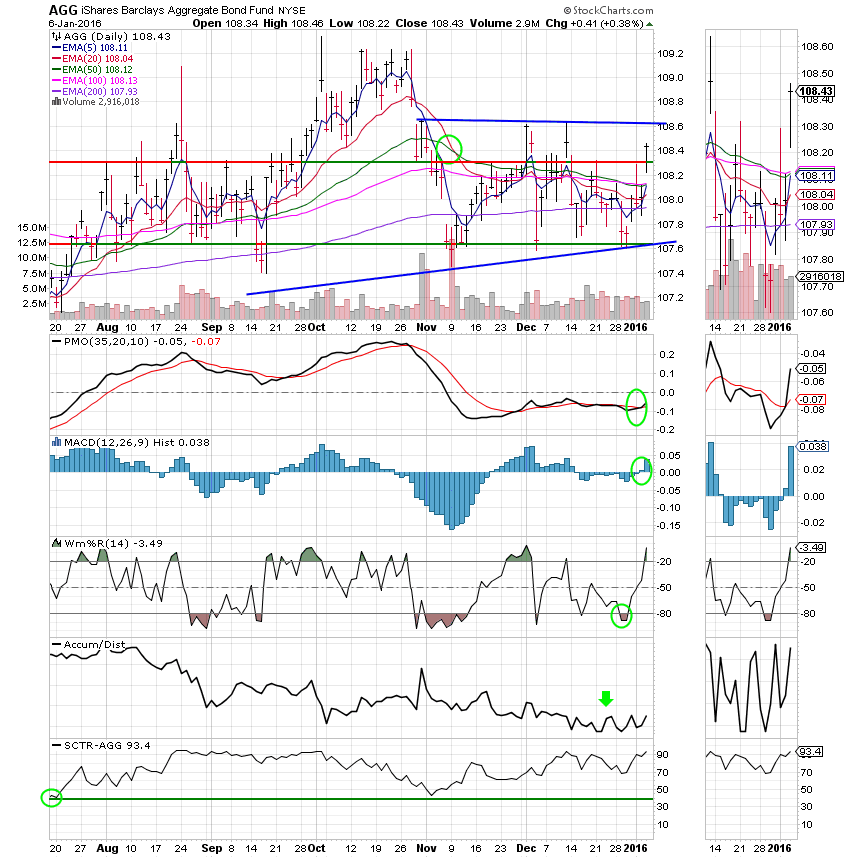
F Fund: The F Fund has improved to a Neutral signal with the PMO, MAC D, and Williams % R moving into positive configurations. A strong SCTR of 93.4 supports this move. The fundamentals however don’t support the move. Anyone investing here is betting that interest rates won’t rise. Perhaps they are correct. We will see. Right now, I prefer the G Fund……