Good Evening, Back in the middle of December our charts told us it was time to sell. So I put out an alert thinking that they will all call me the boy who cried wolf. After all, we had pretty well been whipsawed for the past 5 years. Of course that has been the subject of many newsletters as we discussed the Fed intervention and how the market would some day return to normal when it was gone. By the matter of fact, I said it so many times that I quit saying it. I actually started to believe that I might be wrong this time. The Fed intervention had left my system that had worked so well for many years in shreds. How could I defend that. Well it took a lot longer than any of us anticipated but that time has finally come at last. It has been so long since any of us have seen a real correction that most of us were caught long when the market failed to turn right back up.
Today the market sold off in dramatic fashion. Does it even matter what the reason was?? Our charts were all over it and our money is safe in the G Fund. Praise God for His guidance once again!!! For those with enquiring minds, the media excuse for this selloff is the growing supply of oil….Yeah right, that’s new and earth shattering news. I guess that at least it’s market shattering news. If you don’t learn anything else here learn this. The news is often written to fit the market instead of being shaped by the market. If you want the true and usually not misleading news then look at your charts. If you want to play a dangerous guessing game depend on the media……
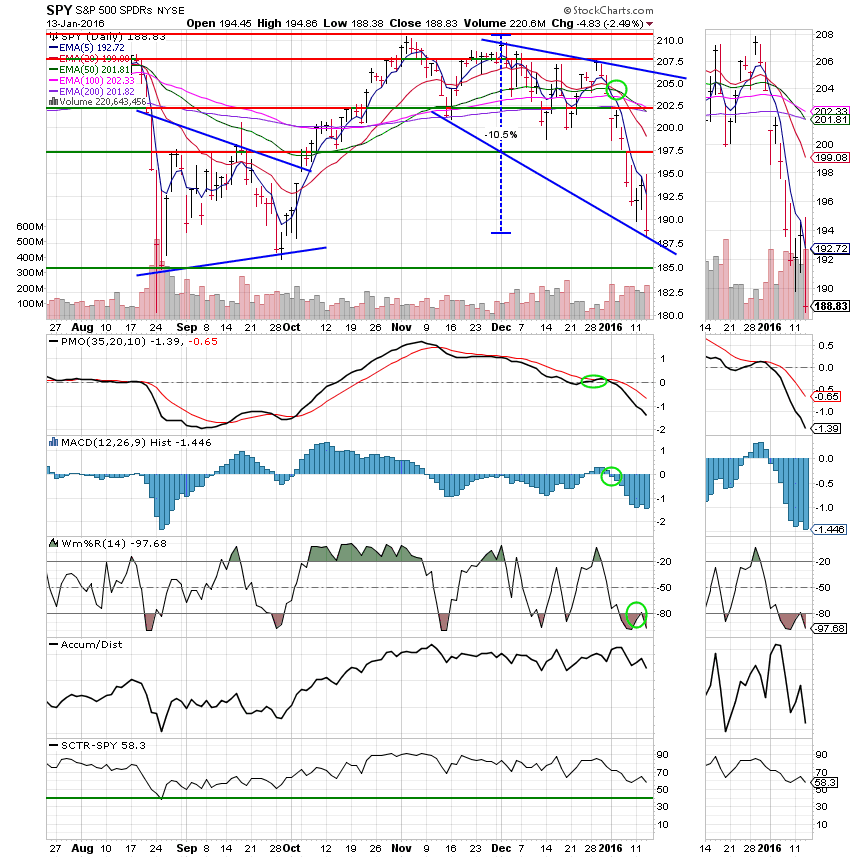
The days trading left us with the following results: Our TSP allotment was safe in the G Fund. For comparison, (cover your eyes if you can’t stand the sight of blood) the Dow lost -2.21%, the Nasdaq a whopping -3.41%, and the S&P 500 dropped -2.50%. For the record, the Russell 2000 is now down 20%. The technical definition of a bear market. The S&P and the Dow both entered correction territory at greater than -10%. I’ve got news for you folks, the 50 EMA passed down through the 200 EMA on the chart for the S&P 500 today. According to technical analysis, that’s a bear market. So that’s what I’m going to call it. As I mentioned in an earlier blog, many if not most stocks are already in a bear market with losses of greater than 20 percent. Folks, I can’t tell you how far it is going to go, but I can tell you it is still going down. Beware of the countertrend bounce. Don’t get sucked in by triple digit rally. Bounces during a bear market are always the biggest and best, but they will leave you high and dry when the downtrend resumes. Could it turn back up tomorrow? Possible, but not probable. Wait until you have confirmation on your charts before you jump back in!!!!
Wall St. resumes selloff; S&P 500 lowest since September
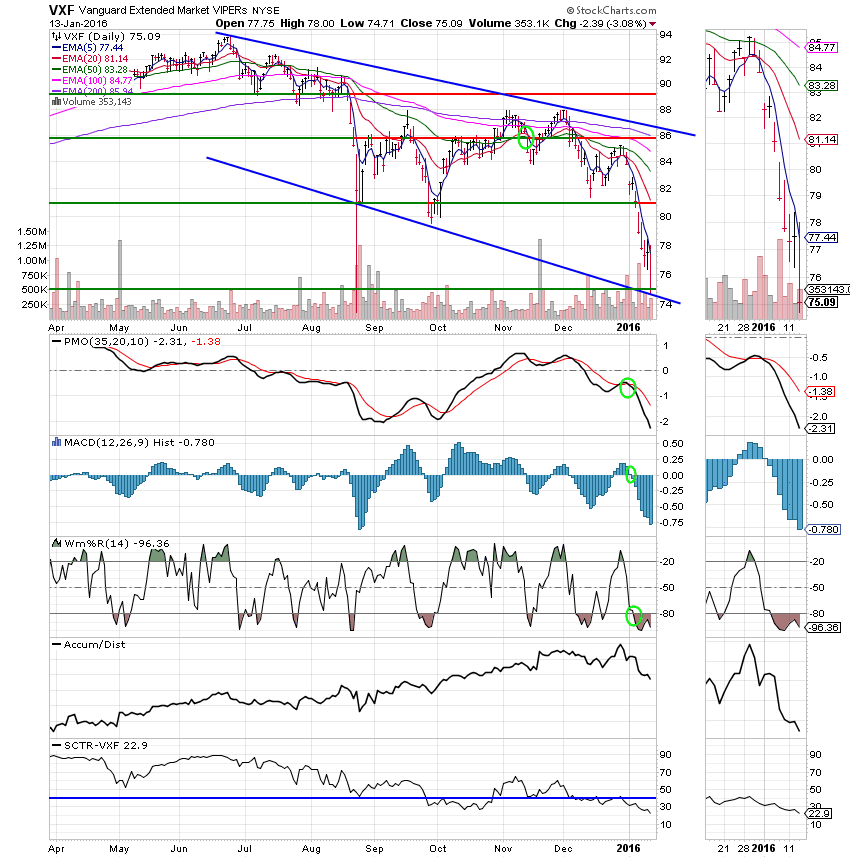
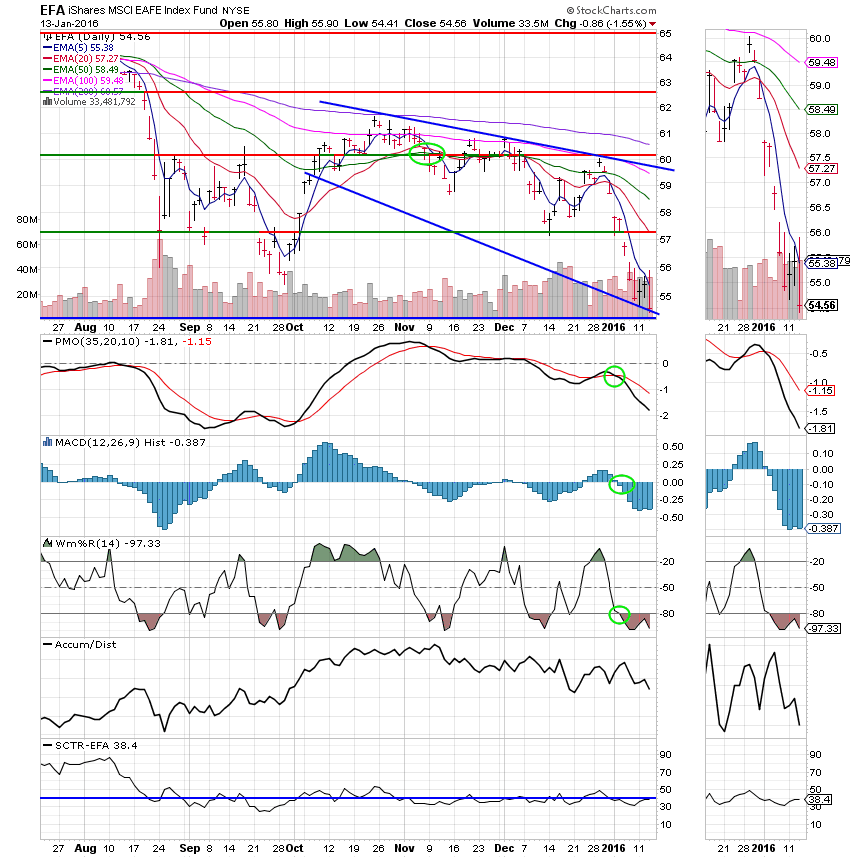
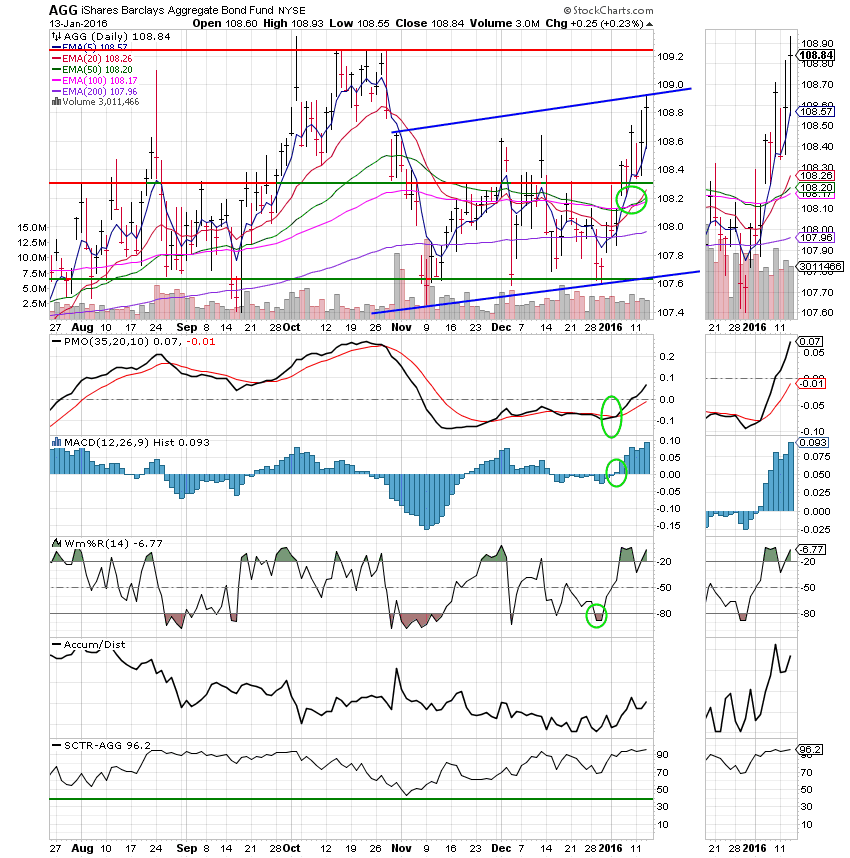
The days action left us with the following signals: C-Sell, S-Sell, I-Sell, F-Buy. Our TSP allotment is now +0.08% on the year not including the days results. Here are the latest posted results:
| 01/13/16 | Prior Prices | ||||
| Fund | G Fund | F Fund | C Fund | S Fund | I Fund |
| Price | 14.9272 | 17.1164 | 25.5099 | 31.5979 | 22.458 |
| $ Change | 0.0009 | 0.0096 | -0.6495 | -1.0074 | -0.2342 |
| % Change day | +0.01% | +0.06% | -2.48% | -3.09% | -1.03% |
| % Change week | +0.03% | +0.29% | -1.64% | -3.40% | -0.44% |
| % Change month | +0.08% | +0.95% | -7.45% | -10.32% | -6.79% |
| % Change year | +0.08% | +0.95% | -7.45% | -10.32% | -6.79% |
| L INC | L 2020 | L 2030 | L 2040 | L 2050 | |
| Price | 17.5173 | 22.3752 | 23.8293 | 25.0474 | 14.0426 |
| $ Change | -0.0740 | -0.2264 | -0.3322 | -0.4070 | -0.2602 |
| % Change day | -0.42% | -1.00% | -1.37% | -1.60% | -1.82% |
| % Change week | -0.26% | -0.69% | -0.97% | -1.15% | -1.33% |
| % Change month | -1.44% | -3.59% | -4.92% | -5.74% | -6.55% |
| % Change year | -1.44% | -3.59% | -4.92% | -5.74% | -6.55% |