Good Evening, We got our oversold bounce today. Are we putting in a bottom? Probably not. I say that with the following caveat. I can tell you that stocks are going down. I can tell you that we are in a bear market. What I can’t tell you is exactly when we’ll hit the bottom. What I can do is identify it at an early stage so you will have plenty of time to react to it. Technical analysis can tell you which way the wind is blowing, but it is not a crystal ball. I know a lot of folks in the media predict the future. However, any investor worth his salt will tell you that he doesn’t know anything about the future and you should steer clear of anyone that says he (or she) can. Technical analysis is a tool to manage risk. I think it is the best toll to manage risk. However, there is no tool that will eliminate risk! Which brings me to my point. Todays rally was a nice oversold bounce, but at this point there is nothing in the charts that indicates that it is anything more than that. More than likely there are lot of folks that got sucked back in for some more pain. Either that or they got lucky. Only time and the charts will tell for sure…..
Todays bounce was spurred by stabilizing oil prices. What has been our theme lately??? So goes oil so goes the market. Not too long ago it was all about the Fed and it will be again as we get closer to the next projected rate increase, but for now the spotlight remains on oil.
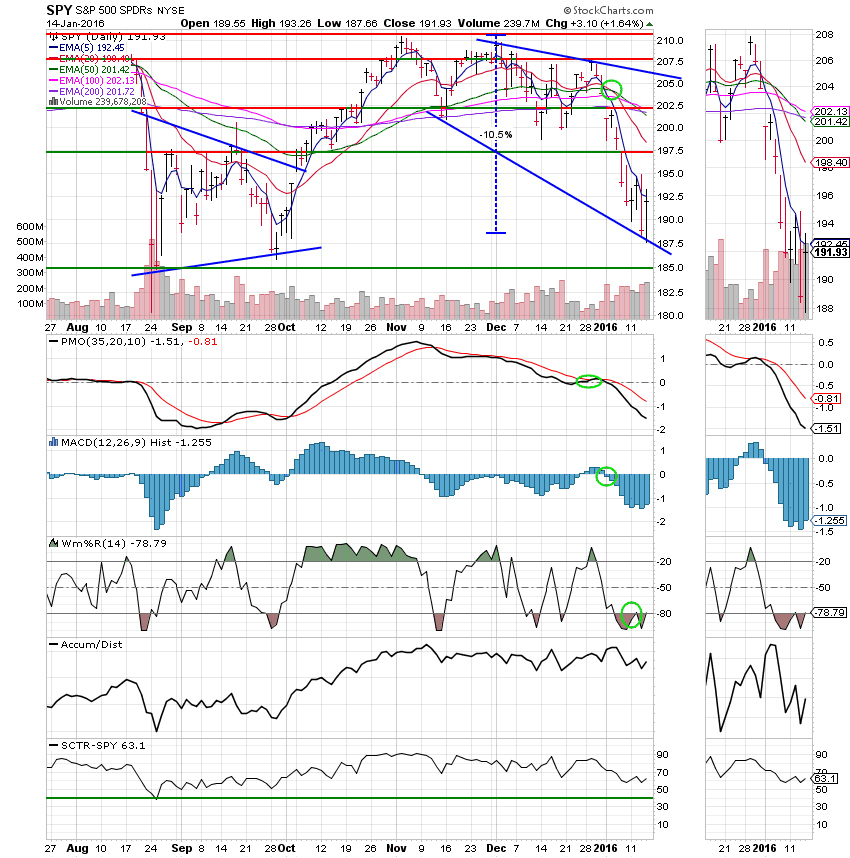
The days trading left us with the following results: Our TSP allotment was steady in the G Fund. For comparison, the Dow gained +1.41%, the Nasdaq +1.97%, and the S&P 500 +1.67%. Not a bad day, but remember, we’re still in a bear market.
Energy leads Wall Street rebound; S&P has best day since December
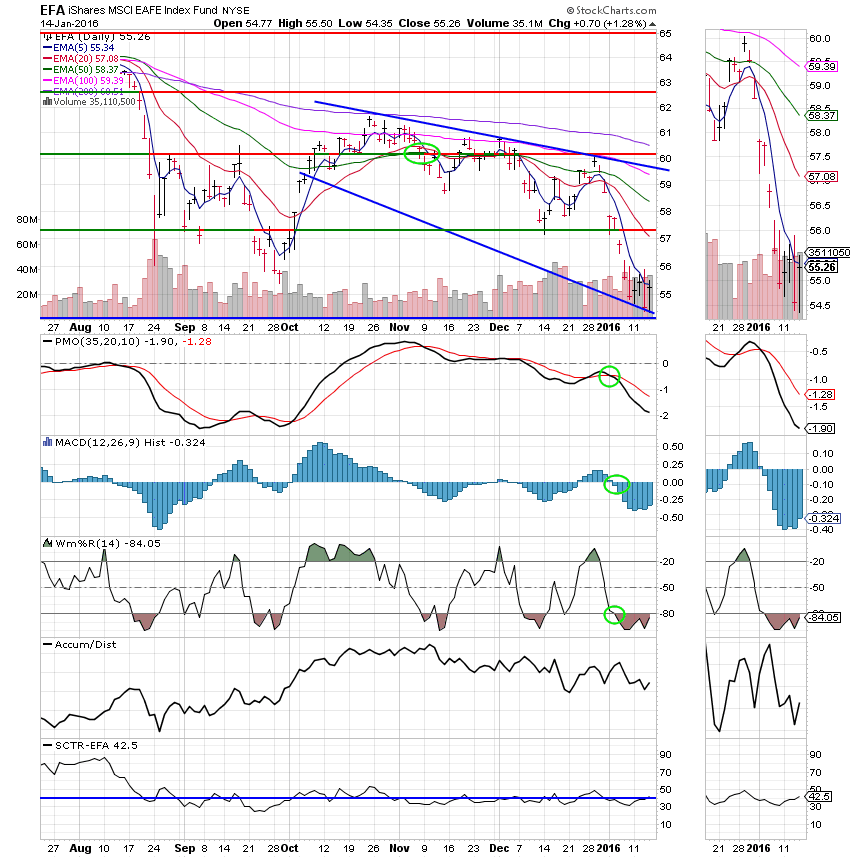
The days action left us with the following signals: C-Sell, S-Sell, I-Sell, F-Buy. We are currently invested at 100/G. Our allocation is now +0.08% on the year not including the days results. Here are the latest posted results:
| 01/13/16 | Prior Prices | ||||
| Fund | G Fund | F Fund | C Fund | S Fund | I Fund |
| Price | 14.9272 | 17.1164 | 25.5099 | 31.5979 | 22.458 |
| $ Change | 0.0009 | 0.0096 | -0.6495 | -1.0074 | -0.2342 |
| % Change day | +0.01% | +0.06% | -2.48% | -3.09% | -1.03% |
| % Change week | +0.03% | +0.29% | -1.64% | -3.40% | -0.44% |
| % Change month | +0.08% | +0.95% | -7.45% | -10.32% | -6.79% |
| % Change year | +0.08% | +0.95% | -7.45% | -10.32% | -6.79% |
| L INC | L 2020 | L 2030 | L 2040 | L 2050 | |
| Price | 17.5173 | 22.3752 | 23.8293 | 25.0474 | 14.0426 |
| $ Change | -0.0740 | -0.2264 | -0.3322 | -0.4070 | -0.2602 |
| % Change day | -0.42% | -1.00% | -1.37% | -1.60% | -1.82% |
| % Change week | -0.26% | -0.69% | -0.97% | -1.15% | -1.33% |
| % Change month | -1.44% | -3.59% | -4.92% | -5.74% | -6.55% |
| % Change year | -1.44% | -3.59% | -4.92% | -5.74% | -6.55% |