
Good Evening, My Dad is in the hospital again so I will keep this brief. The market had a tug of war between good news and bad news, ultimately closing up but well off it’s highs for the day. The days give and take left us with the following results. Our TSP allotment was steady in the G Fund. For comparison, the Dow had a gain of +0.74%, the Nasdaq +0.01%, and the S&P 500 +0.52%. Folks, up to this point, the charts have shown me no indication that they are in anything other than a down trend. Right now key support for the S&P 500 is holding at 1850. Ultimately, It will either give way and we’ll head lower or we’ll move back up. My bet is that the support will not hold and if it does not my downside target is 1450. You definitely want to know which way we are heading before you get back in. Should it occur, the next leg down will be painful!
Badly bruised Wall Street finds solace in oil rebound
The days action left us with the following signals: C-Sell, S-Sell, I-Sell, F-Buy. We are currently invested at 100/G. Our allocation is now +0.12% on the year not including the days results. Here are the latest posted results:
| 01/20/16 | Prior Prices | ||||
| Fund | G Fund | F Fund | C Fund | S Fund | I Fund |
| Price | 14.9337 | 17.1417 | 25.0985 | 30.9839 | 21.4586 |
| $ Change | 0.0009 | 0.0087 | -0.2925 | -0.0689 | -0.6675 |
| % Change day | +0.01% | +0.05% | -1.15% | -0.22% | -3.02% |
| % Change week | +0.03% | +0.09% | -1.10% | -1.34% | -2.03% |
| % Change month | +0.12% | +1.10% | -8.94% | -12.07% | -10.94% |
| % Change year | +0.12% | +1.10% | -8.94% | -12.07% | -10.94% |
| L INC | L 2020 | L 2030 | L 2040 | L 2050 | |
| Price | 17.4349 | 22.1136 | 23.4451 | 24.5774 | 13.7427 |
| $ Change | -0.0543 | -0.1644 | -0.2383 | -0.2888 | -0.1828 |
| % Change day | -0.31% | -0.74% | -1.01% | -1.16% | -1.31% |
| % Change week | -0.26% | -0.65% | -0.90% | -1.05% | -1.20% |
| % Change month | -1.90% | -4.72% | -6.46% | -7.50% | -8.54% |
| % Change year | -1.90% | -4.72% | -6.46% | -7.50% | -8.54% |
Lets take a look at the charts: (All signals annotated with Green Circles) If you click on the charts they will become larger!
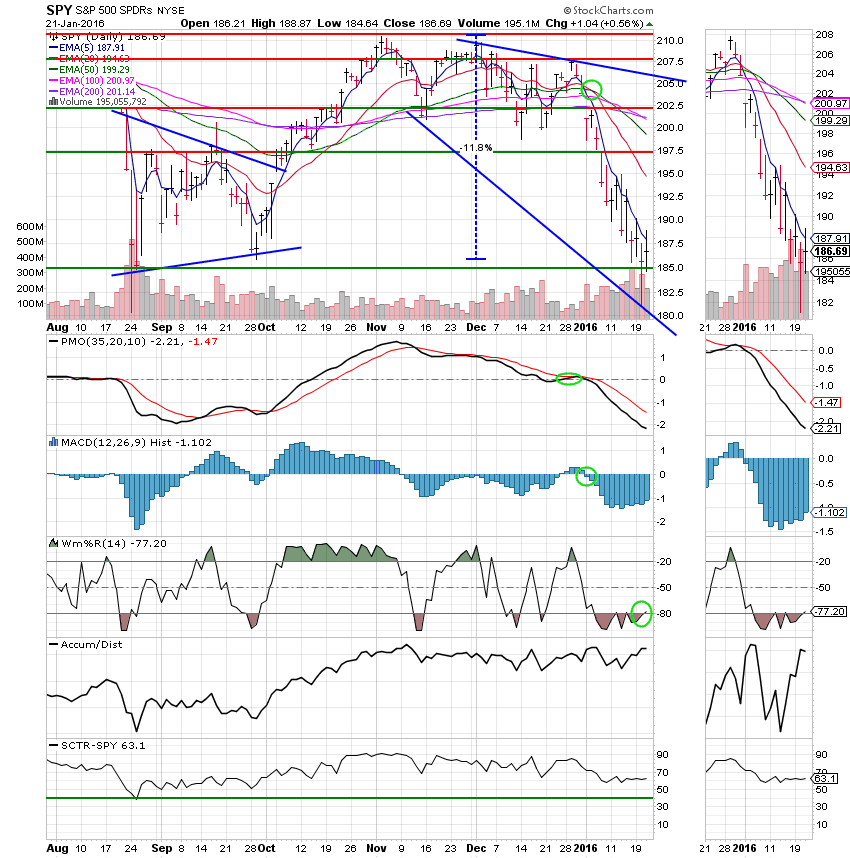
C Fund: The Williams % R moved into a positive configuration possibly signaling a short run. We’ll be careful of a whipsaw here!
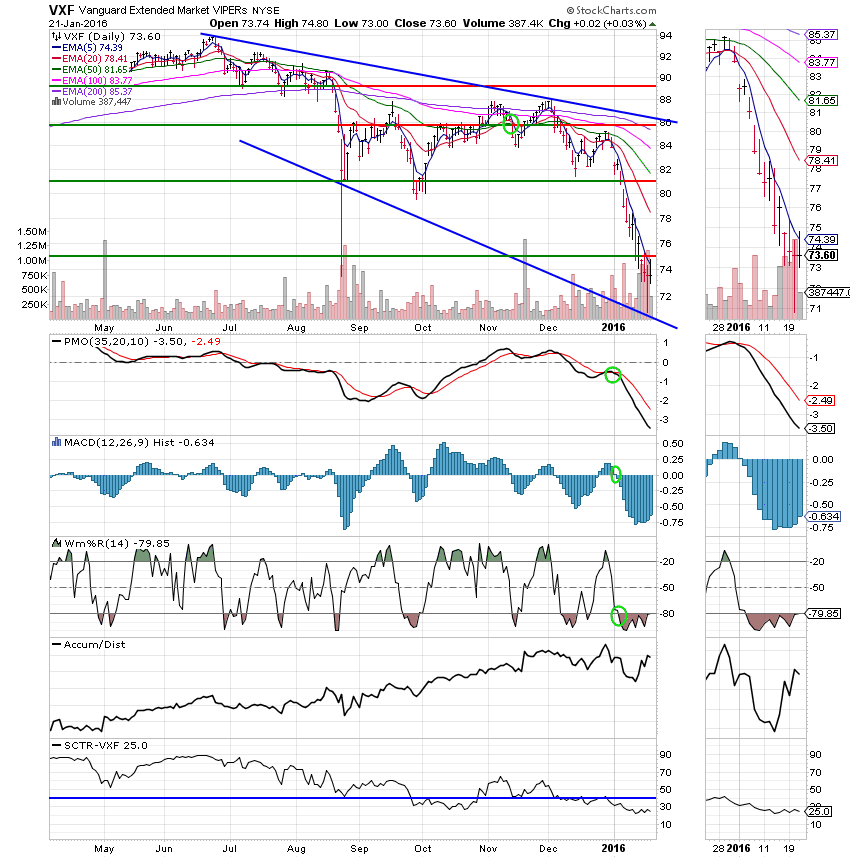
S Fund:
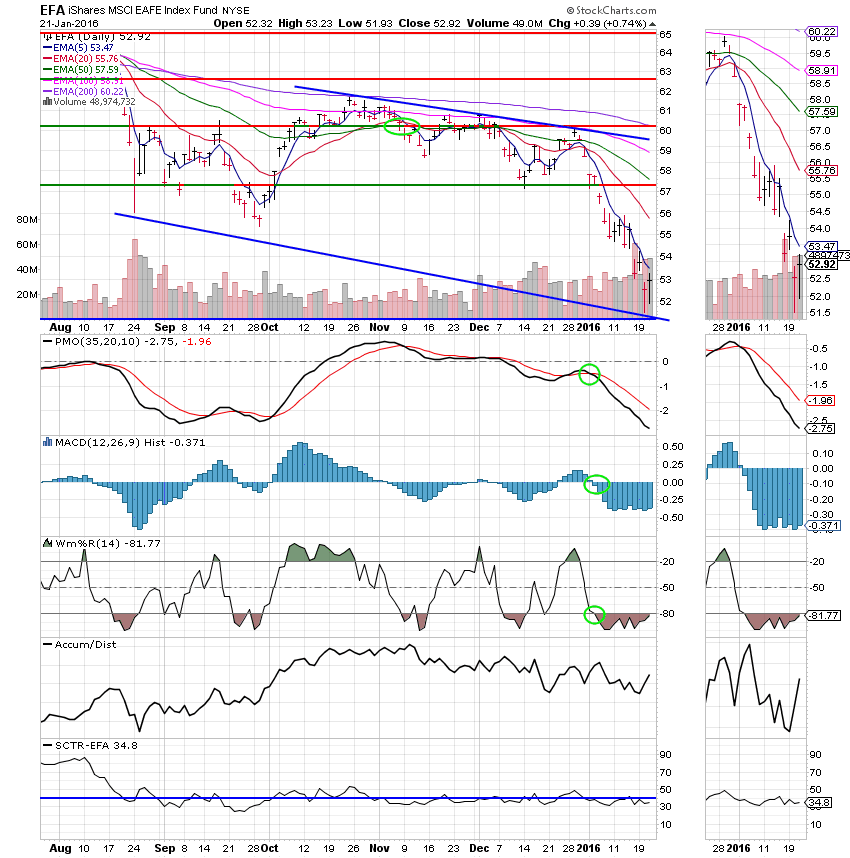
I Fund:
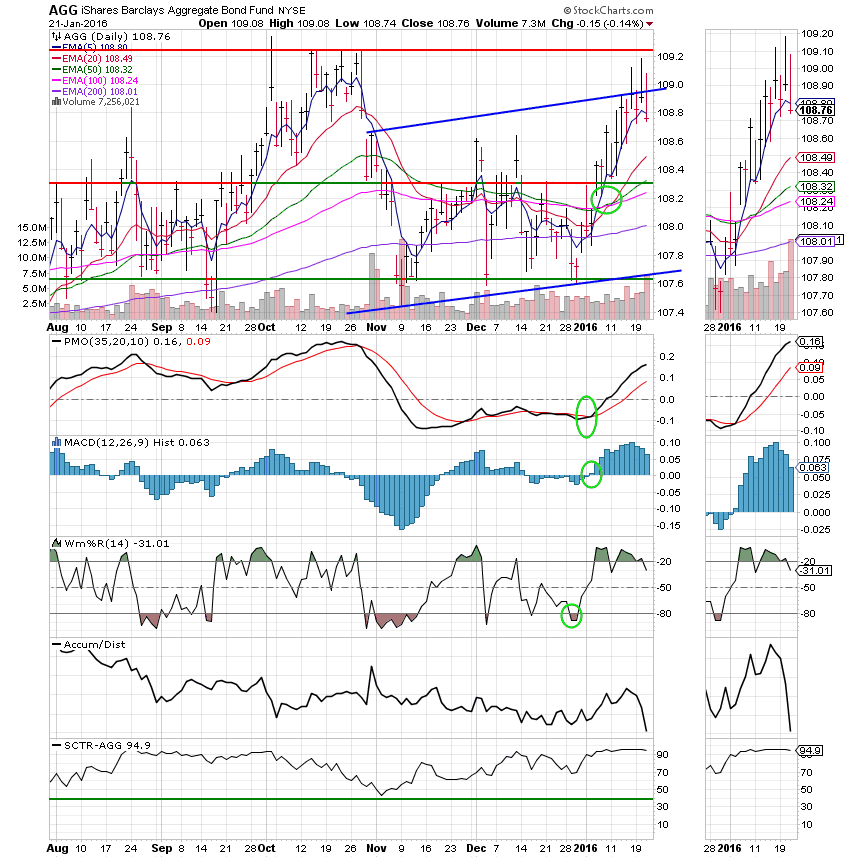
F Fund: Price continues to be repelled at the upper trend line. One thing of great concern with this chart is the Accum/Dist line. It indicates that money is flowing out of this fund. I wonder what’s propping it up???????
That’s all for tonight. I have to get some rest and head back to the hospital if I can make it as the weather is supposed to be real bad here.. I covet your prayers for my Dad. Keep an eye on your charts, but don’t hold your breath. I will be surprised if we see any sustained upward movement for a while yet. Have a great evening!