Good Evening, It’s hard to keep inventing ways to write about how relentless this market is. It’s truly incredible. I have to go back to one thing that I posted a few blogs ago. It was part of the decision point blog which is written by Erin Swenlin Heim. It’s the middle or maiden name that you want to pay attention to. Her Dad is Carl Swenlin. At least to me he is one of the God Fathers of Technical Analysis. I actually got my start by studying on his web site which was the former DecisionPoint.com which merged with StockCharts.com that is now my charting site. Anyway, Carl pretty well turned the reigns over to Erin but occasionally contributes to the blog. In a recent blog He presented his theory as to why this market continues to rise and may keep going higher. Here it is in case you missed it. I agree totally with what he has to say.
The New Normal
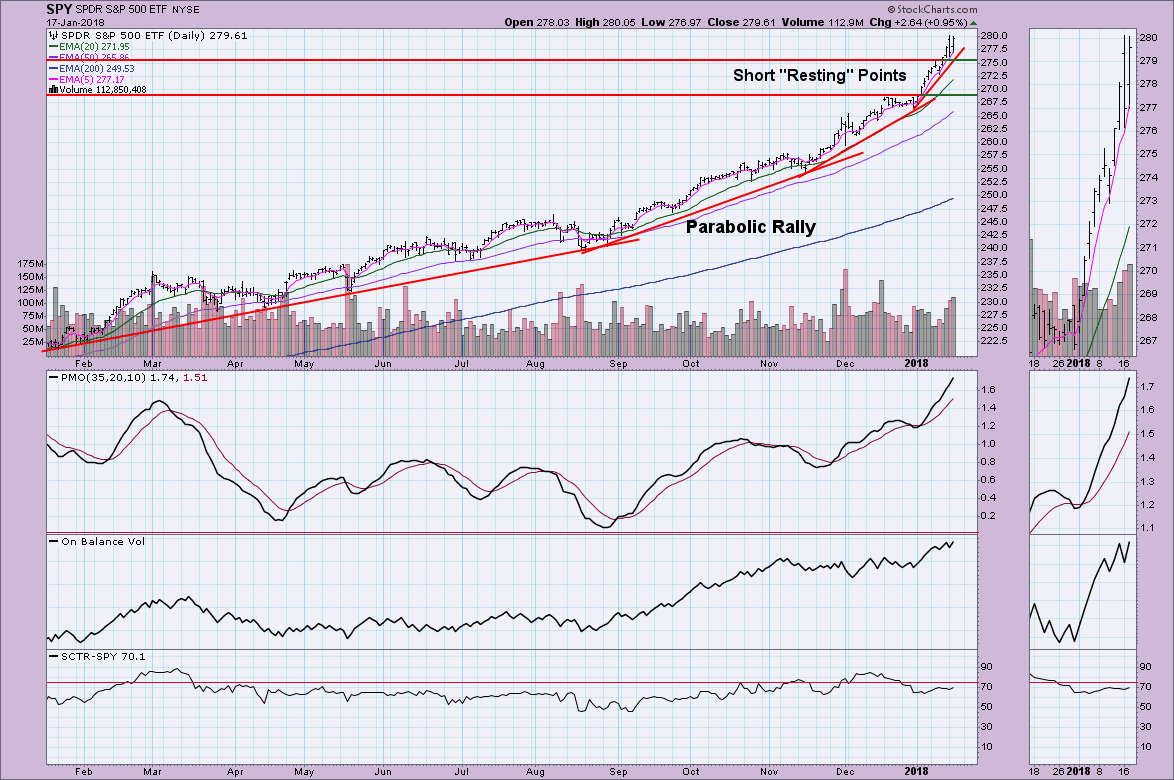
As we watch the SPX continue to move higher in parabolic fashion, it’s of course natural to begin to worry about a market collapse. During today’s
MarketWatchers LIVE show, Tom and I went over what we think are good “alerts” to the bear market switchover. However, Carl made a great point in Friday’s “Weekly Wrap” that we could be looking at a “
new normal” as far as bull and bear markets are concerned.
Note the long-term monthly chart below. Monthly PMO SELL signals have worked quite well to warn of impending bear markets or corrections. When I talk about a “new normal”, the monthly chart already shows some moves to “new normals”. In the late 80’s/90’s where new all-time highs were set and the original ‘trading range’ of the SPX moved higher with looser fiscal policies and the “dot com” explosion. This could be what we’re looking at right now with the tinder being a more business-friendly environment based on corporate taxes and an expanding economy. So when I say, “new normal”, I’m talking about the establishment of a new very long-term trading range. Like the 90’s, we could be seeing a similar type of “travel time” which means few corrections and no serious bear markets. The monthly PMO does keep us fairly safe along the way.
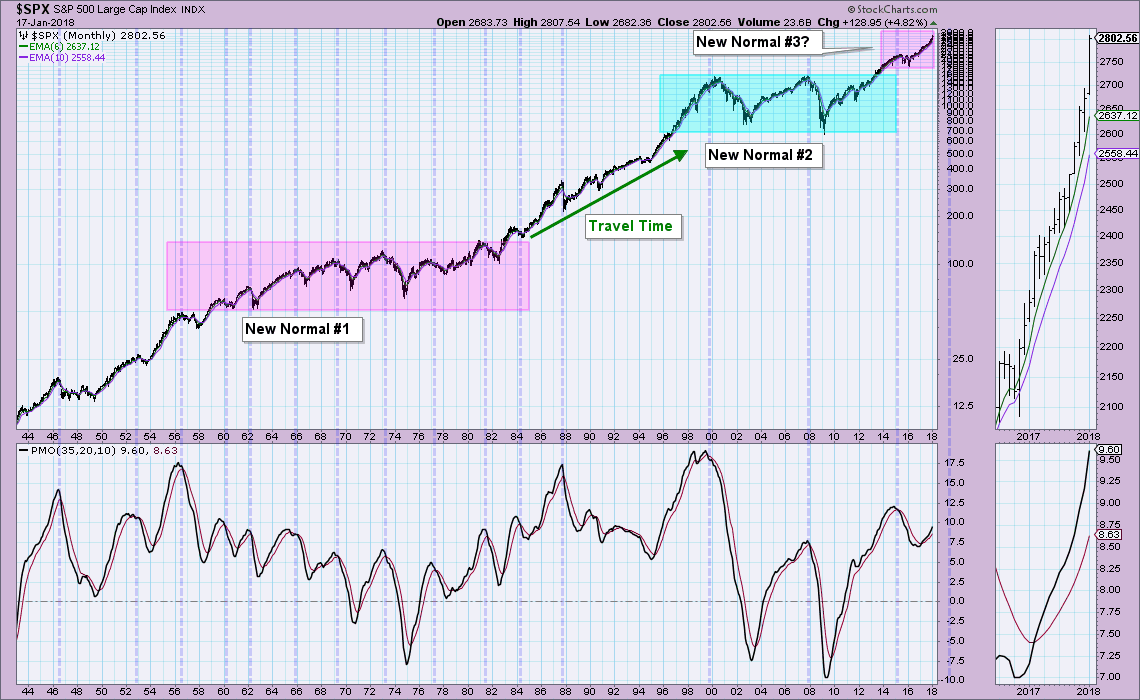
Given that we could be looking at a travel period to a new trading range, the parabolic chart pattern may not be as much of a problem after all. The market has had periods of ‘rest’ during this rise and even a few small pullbacks. I suggest that this could continue for a few more years or so, but we will likely see some more serious downturns along the way as the market does get stretched thin. In the shorter term, I’m concerned about the very overbought PMO.
Of course the looser fiscal policy this time is the tax reform bill. We’ve spent a lot of time talking about how the tax reform would lead to increased corporate profits which would create value in stocks. If that’s the case then above is a chart that supports it. I agree that we will have a meaningful pullback at some point. The S&P 500 has reached a streak of 396 trading days without a 5-percent correction, according to LPL Financial, the longest on record. The benchmark index has closed within 5 percent of a record in 467 of the past 468 trading days.This can’t go on forever. That’s not what I’m saying. What I am saying and what Carl is saying is that when we do finally have a real pullback that the market won’t return to the pre 2015 trading range. As I have often repeated, when that time comes our charts will tell us when to sell before the damage becomes too severe. All we have to do is to be vigilant and check our charts daily. Even when we don’t feel like it……..
Today the market rose on a great earns report by Netflix (NFLX). Here are the results: Our TSP allotment posted a gain of +0.22%. For comparison, The Dow was flat at -0.01%, the Nasdaq added +0.71% and the S&P 500 was up +0.22%. Thank God for another good day.
The days action left us with the following signals: C-Buy, S-Buy, I-Buy, F-Sell. We are currently invested at 100/C. Our allocation is now +5.23% on the year including the days results. Here are the latest posted results:
| 01/23/18 |
Prior Prices |
| Fund |
G Fund |
F Fund |
C Fund |
S Fund |
I Fund |
| Price |
15.5639 |
17.9644 |
39.9718 |
51.0106 |
32.7399 |
| $ Change |
0.0011 |
0.0352 |
0.0881 |
0.1875 |
0.2352 |
| % Change day |
+0.01% |
+0.20% |
+0.22% |
+0.37% |
+0.72% |
| % Change week |
+0.03% |
+0.09% |
+1.03% |
+1.05% |
+1.11% |
| % Change month |
+0.15% |
-0.83% |
+6.28% |
+5.25% |
+6.11% |
| % Change year |
+0.15% |
-0.83% |
+6.28% |
+5.25% |
+6.11% |
| |
L INC |
L 2020 |
L 2030 |
L 2040 |
L 2050 |
| Price |
19.796 |
27.4653 |
31.8669 |
34.9317 |
20.3546 |
| $ Change |
0.0189 |
0.0424 |
0.0817 |
0.1051 |
0.0690 |
| % Change day |
+0.10% |
+0.15% |
+0.26% |
+0.30% |
+0.34% |
| % Change week |
+0.24% |
+0.39% |
+0.66% |
+0.78% |
+0.88% |
| % Change month |
+1.26% |
+2.14% |
+3.68% |
+4.34% |
+4.94% |
| % Change year |
+1.26% |
+2.14% |
+3.68% |
+4.34% |
+4.94% |
Now lets take a look at the charts. All signals are annotated with green circles. If you click on the charts they will become larger.
C Fund:
S Fund:
I Fund:
F Fund:
It’s been another good day. Keep watching your charts! That’s all for tonight. Have a great evening and may God continue to bless your trades!
God bless, Scott 
***Just a reminder that you can review the performance of our allocation at the Web Site TSPTALK.com in the autotracker section under the screen name KyFan1.
I produce and publish this blog as both a ministry and for the benefit of any Federal Government Employee. This is done to offer you some guidance as to how to approach your retirement more financially successful. When it is time for you to retire, I recommend you utilize the services of a Professional Money Manager, who works with a reputable investment firm. He understands the guidance you have already received and he can manage your savings assets utilizing a more advanced investment program into the future.
If you would like to receive more information about this introduction, please feel free to contact me at KyFan1@aol.com.


