
Good Evening, Mercifully, this month has come to an end. Although it did end with a bang. Oversold bounces in a down trending market tend to be some of the best and today was a good one. The market was ignited this morning by a report that Japan’s central bank had moved the country’s interest rate to negative 0.10 %. In other words folks in Japan will have to pay the banks to keep there money. Also, adding fuel to the fire was an excellent earning report from Microsoft.
The days rally left us with the following results. Our TSP allotment was steady in the G Fund while the Dow added +2.47%, the Nasdaq +2.38%, and the S&P 500 +2.48%. I was a nice oversold rally. However, that’s all we can say about it at this point as we don’t have confirmation that things have changed. We’ll glean the charts for that information as soon as it becomes available.
Wall Street surges at end of awful January
The months action left us with the following signals: C-Neutral, S-Neutral, I-Neutral, F-Buy. We are currently invested at 100/G. Our allotment is now +0.17% on the year not including the days results. Here are the latest posted results:
| 01/28/16 | Prior Prices | ||||
| Fund | G Fund | F Fund | C Fund | S Fund | I Fund |
| Price | 14.9411 | 17.1509 | 25.5626 | 31.2149 | 22.2699 |
| $ Change | 0.0009 | 0.0130 | 0.1425 | -0.0765 | -0.1509 |
| % Change day | +0.01% | +0.08% | +0.56% | -0.24% | -0.67% |
| % Change week | +0.04% | +0.26% | -0.69% | -1.69% | +0.43% |
| % Change month | +0.17% | +1.16% | -7.25% | -11.41% | -7.58% |
| % Change year | +0.17% | +1.16% | -7.25% | -11.41% | -7.58% |
| L INC | L 2020 | L 2030 | L 2040 | L 2050 | |
| Price | 17.5199 | 22.3524 | 23.7863 | 24.9889 | 14.002 |
| $ Change | 0.0042 | 0.0088 | 0.0108 | 0.0114 | 0.0060 |
| % Change day | +0.02% | +0.04% | +0.05% | +0.05% | +0.04% |
| % Change week | -0.06% | -0.22% | -0.31% | -0.38% | -0.44% |
| % Change month | -1.43% | -3.69% | -5.10% | -5.96% | -6.82% |
| % Change year | -1.43% | -3.69% | -5.10% | -5.96% | -6.82% |
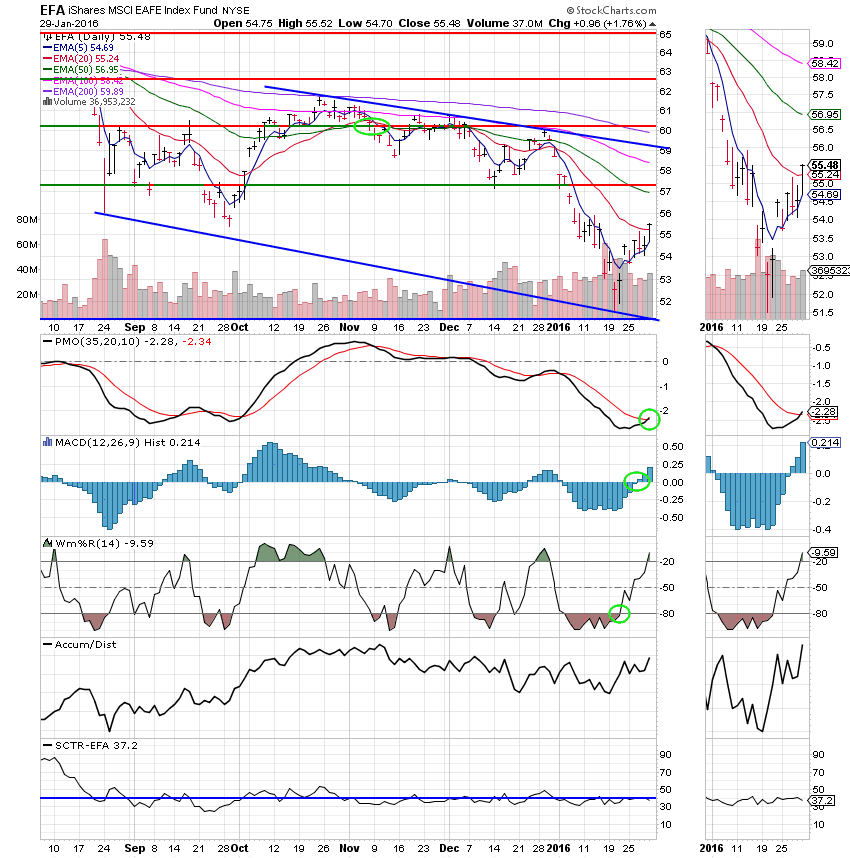
Lets take a look at the charts: (All signals annotated with Green Circles) If you click on the charts they will become larger!
C Fund: The C Fund is now at neutral with the MACD and Williams%R in positive configurations. We made some improvement in this and all of our equity based funds. However, we don’t have any confirmation whatsoever that the market has changed directions. I will not consider putting any capital to work in equities until at a minimum the 5 EMA passes up through the 200 EMA and then only in increments.

S Fund: Same as the C Fund.

I Fund: The I Fund is in a little better shape at this point than the C and S Funds. It’s PMO, MACD, and Wms%R have all moved into positive configurations. So why is it a neutral and not a buy? Because Price, our most important indicator is still on a solid sell signal with the EMA’s upside down. In other words the 200EMA > 100EMA > 50EMA > 20 EMA > 5 EMA. Thus, it can be no better than neutral.
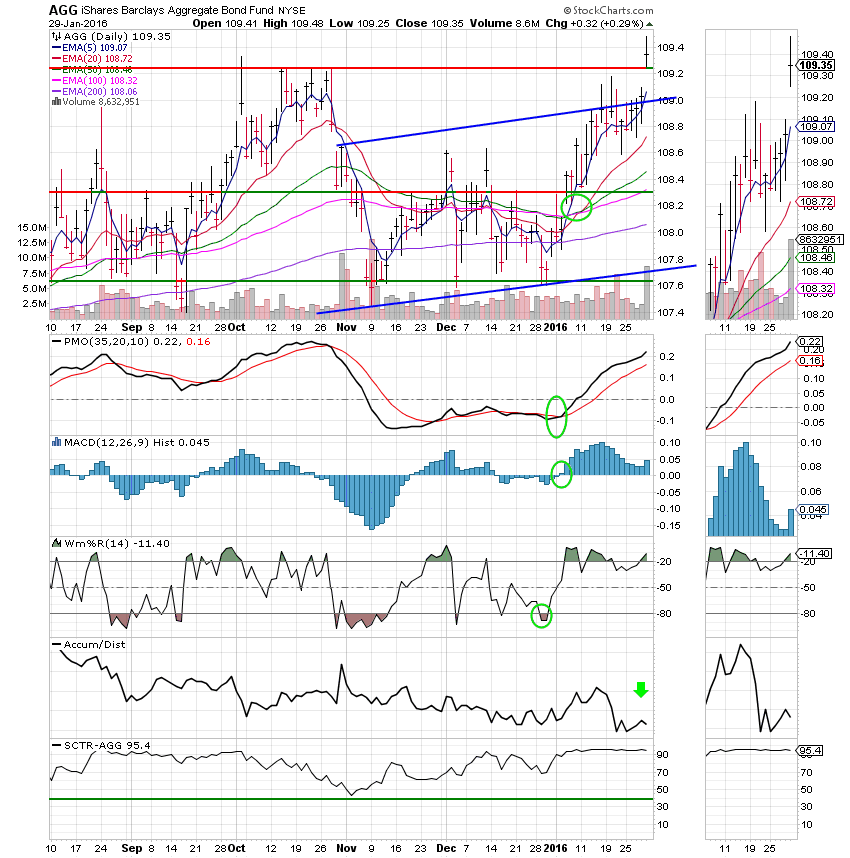
F Fund: Bonds are still working well as investors are betting the Fed won’t increase interest rates any time soon. The only real concern I have with this chart is the Accum/Dist line which indicates that a lot of money is following away from this Fund. Only question is, where is it going? I have annotated this area of the chart with a green arrow.
I know when you see a big rally like this that you get impatient. But remember, it is the disciplined trader that wins in the end. At this time we have no confirmation that this market is heading back up. Until we do the risk is greater than the reward. That’s all for this month! Have a great weekend and may God continue to bless your trades.
God bless, Scott ![]()