Good Morning, Perhaps I’m getting old and don’t remember things clearly, but I just can’t remember a market with this many twists and turns. Even when it was volatile it wasn’t this volatile. I think of the 90’s and even the early 2000’s for that matter. Sure, we had the dot com bubble that burst in 2000 and the financial crisis in 2008/2009, but those things happened, they were intense, and then they were not. Now understand that it still took a lot of time to recover from them. By the matter of fact it took until March of 2005 before all the buy and holders made their money back from the 2000 selloff. However, there was a difference, a big difference between now and then, Once the market started in a direction it tended to stay in that direction. It was easy to follow the trend. It was not at all like today when you have a big drop one day and a big rally next. We have often speculated as to why this is the case and the best thing we could come up with is computer trading. Everyone it doing the Schwab thing or at least some version of it. Trading by and large is no longer a function of just experienced brokers but now it is in the hands of the common man. With that comes a lot of panic and herd mentality. These folks sell first and ask questions later. Unlike the past, just because you have a triple digit sell off does not mean that the market is going down. It means these folks panicked and will make a more infirmed decision after they have had time to consider all the facts. Now this “new style” of trading definitely favored the buy and hold crowd. All the quick selling we described above created pure chaos for the technical traders and we were among them. We struggled mightily for 18 months. Many folks gave up on us and left our group. You know the rest of the story. It took us that time plus and additional 12 months to develop and master a new system that could identify the long term trend through all this madness. And that folks, is where we find ourselves today. Which brings me to my point. If you watch the day to day action in this “new style” market you will be misled. You must do one of two things. You must blindly buy and hold and take what the market gives you or you must be willing to endure some pain when the market sells but you know the overall trend is higher. Read between the lines!!! Unless you have really good charts and indicators like we do, you cannot tell when the market is just having one of its tantrums or when the trend is really changing and moving lower. That is to say to know when you really have to sell. If you cannot tell the difference, then you need to simply do the lifecycle thing and leave it alone. You won’t make as much as you would if you knew when and when not to get out but you will make more than you will if you let the “new style” of trading fake you out. How do we know?? Need you ask?? We had he painful experience listed above that we learned from. Yes indeed, we have experience. So what is the definition of experience? We define it a little differently here. EXPERIENCE – Having made mistakes!!!! We made the mistakes and went through the pain it took to learn to navigate this “new style” market and you know what?? Those folks that suffered through this with us earned the right to enjoy the gains they have now. NO PAIN……NO GAIN……. Its never been more true now than ever! Of course we always want to give credit to an awesome God who guides our hand. Give Him all the praise for He and He alone it worthy!!
So moving on….. this week we continue to struggle with news concerning Tariffs. President Trump is either enacting or proposing new ones every day. For the most part the market is becoming somewhat desensitized to them just like it did in 2016. The bottom line here is that they will help some businesses and hurt others. We will just have to see how they effect things and invest accordingly. In the end the tariffs add additional volatility to an already volatile market. So now it’s even more important than ever to watch the charts closely in order to track the overall trend because your sure not going to be able to recognize it by watching the daily news. No way!! Of course, the rest of the week we have earnings reports sandwiched in between the January consumer price index report on Wednesday at 8:30 a.m. , January’s producer price index reading on Thursday at 8:30 a.m. , and initial jobless claims for the week ending Feb.8 on Thursday at 8:30 a.m. . That folks is it. Unless we have some type of curve ball, those are the things that will determine where we go over the short term. The thing to focus on for now is that the overall trend remains up. So we will stay invested at 100/S.
The days trading so far has produced the following results: Our TSP allotment is trading slightly higher at +0.19%. For comparison, the Dow is adding +0.07%, the Nasdaq +1.17%, and the S&P 500 +0.55%. Praise God for another good day!
Stocks rise, led by tech, as traders look past latest U.S. tariff threat: Live updates
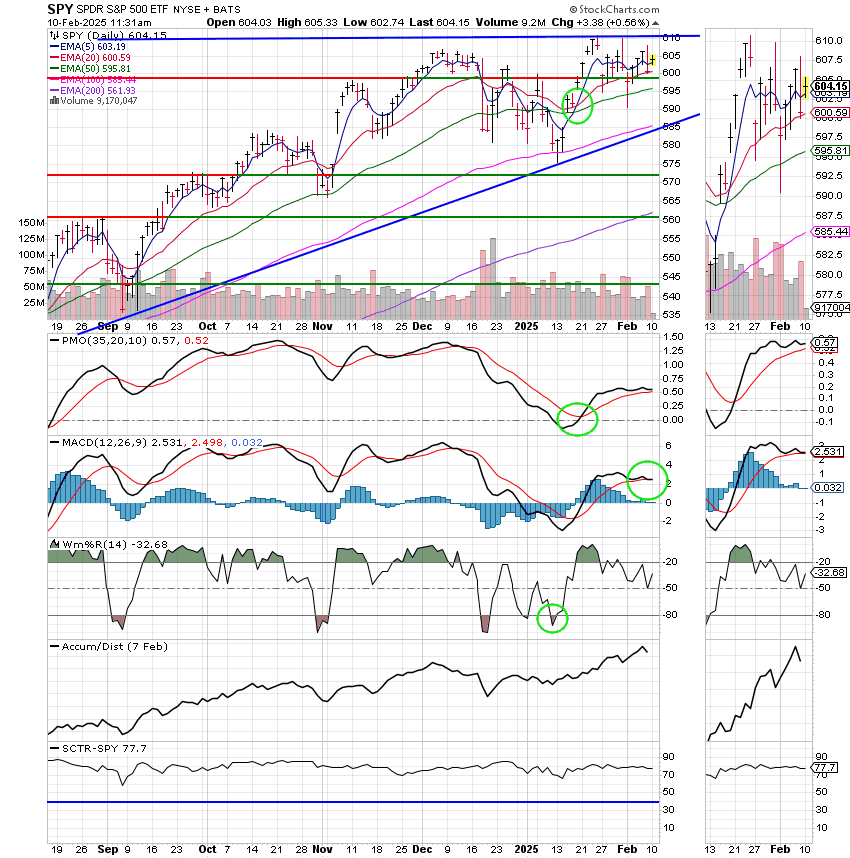
The most recent action has left us with the following signals: C-Buy, S-Buy, I-Buy, F-Buy. We are currently invested at 100/S. Our allocation is now +4.72% on the year not including the days results. Here are the latest posted results:
| 02/07/25 | Prior Prices | ||||
| Fund | G Fund | F Fund | C Fund | S Fund | I Fund |
| Price | 18.8448 | 19.6551 | 95.2989 | 94.4031 | 43.711 |
| $ Change | 0.0024 | -0.0569 | -0.9067 | -0.8464 | -0.2506 |
| % Change day | +0.01% | -0.29% | -0.94% | -0.89% | -0.57% |
| % Change week | +0.09% | +0.39% | -0.22% | -0.26% | +0.63% |
| % Change month | +0.09% | +0.39% | -0.22% | -0.26% | +0.63% |
| % Change year | +0.48% | +0.91% | +2.55% | +4.72% | +4.33% |