
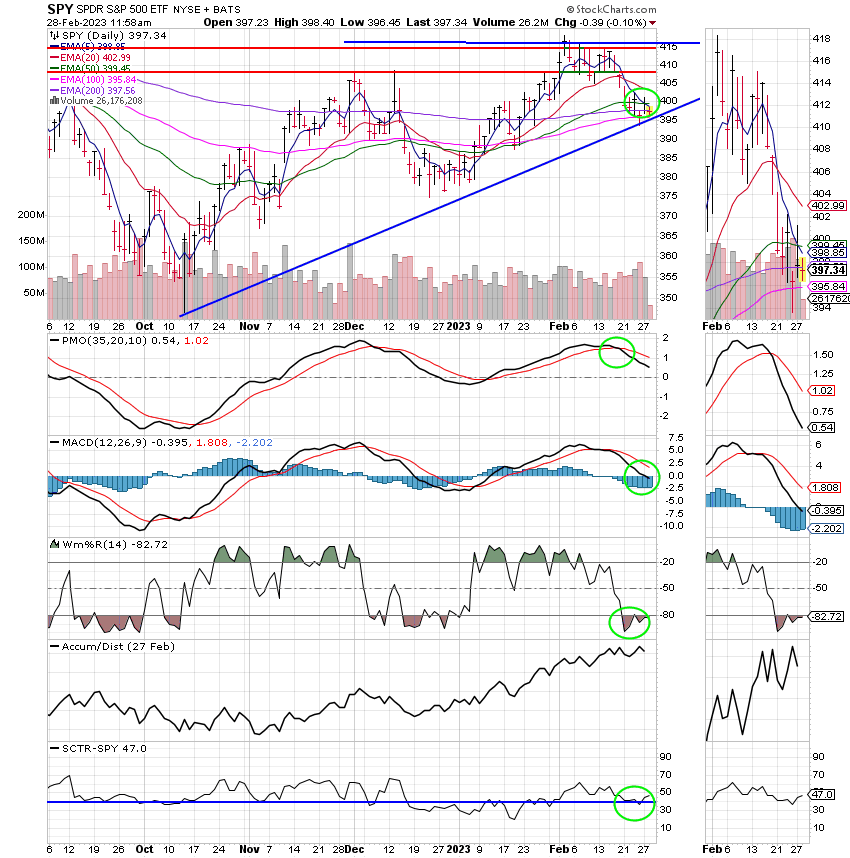
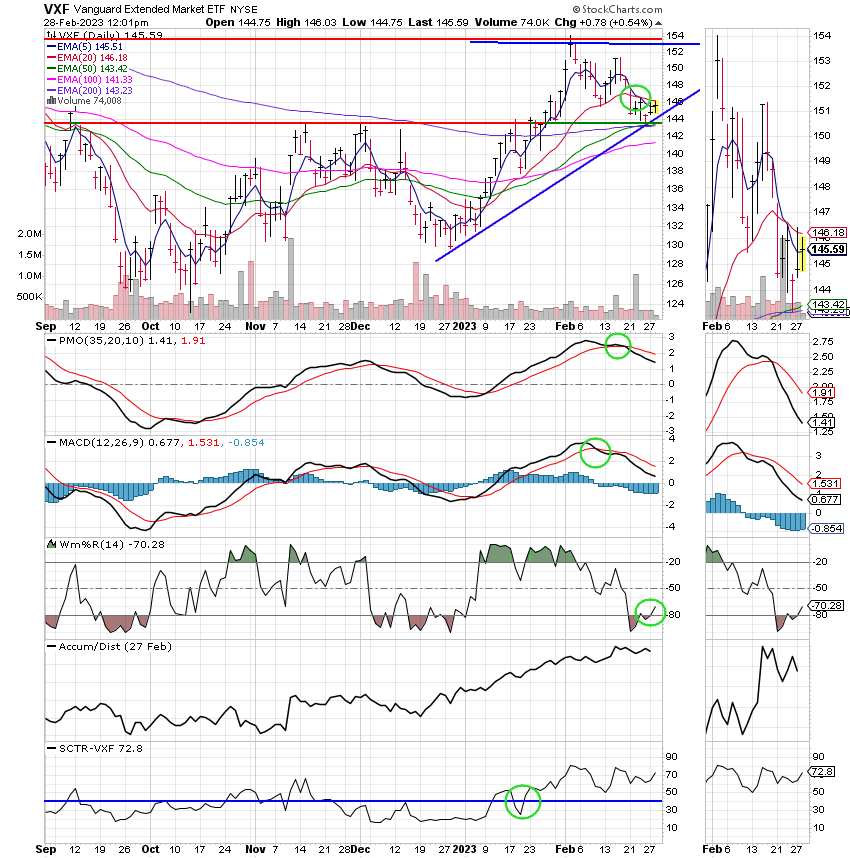
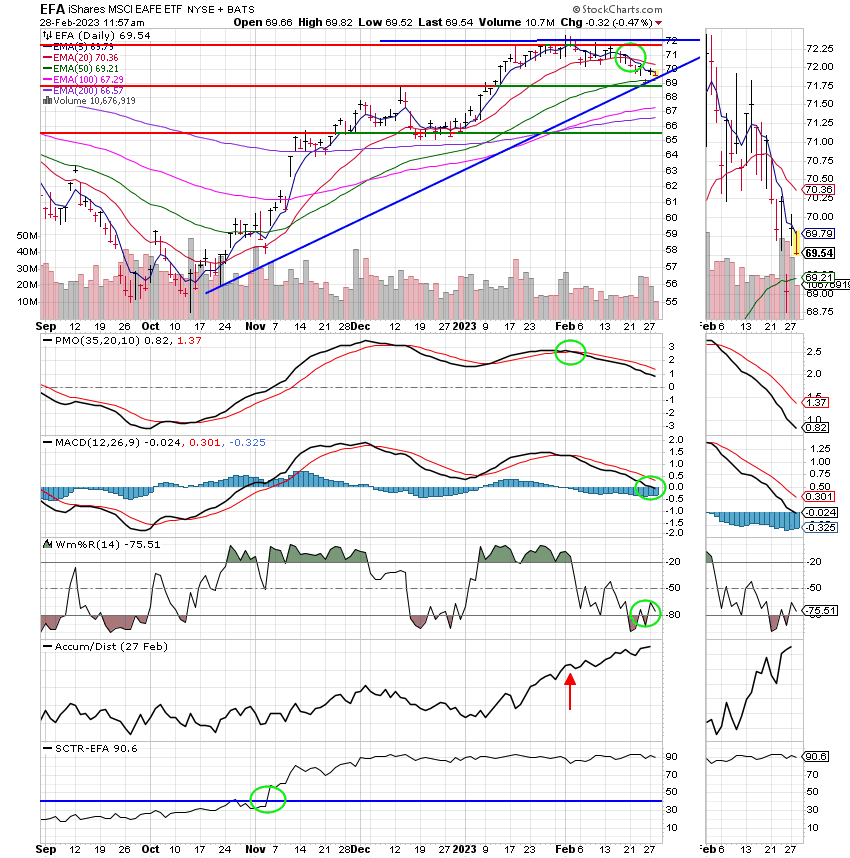
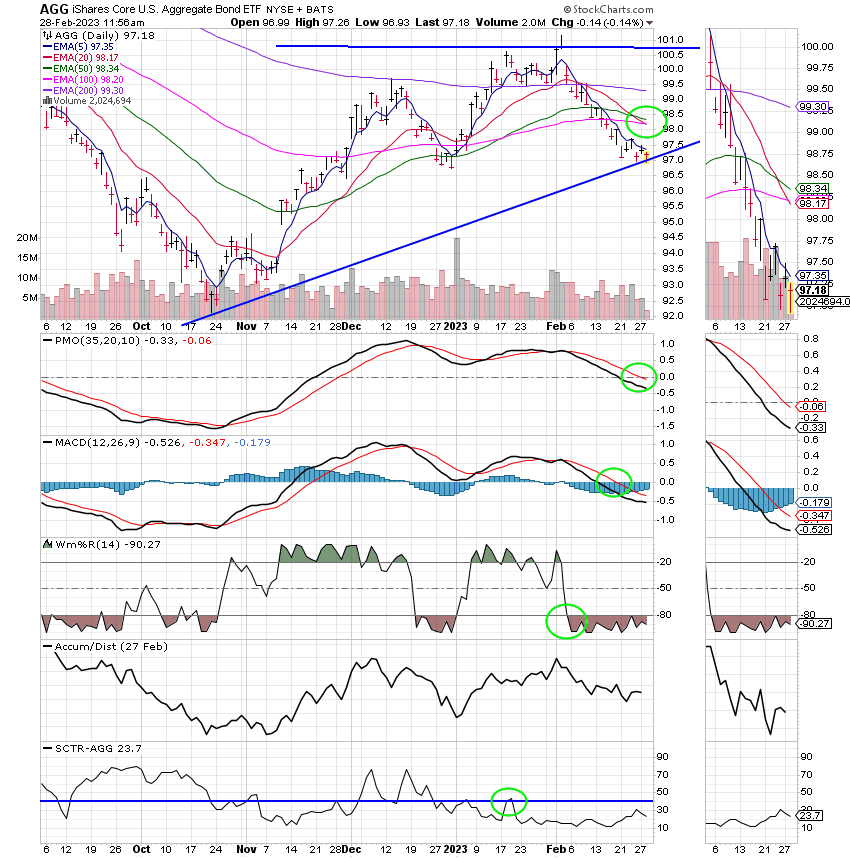
Good Day, Is good news bad or is good news good? Right now it’s a little of both. It’s a balancing act between reducing in inflation and not overwhelming the economy. Ultimately, it all comes down to what the Fed will do and as we have said so many times lately how that effects the rate of inflation. I know you all know this by heart by now but for the benefit of anyone new who might be reading this blog the Federal Reserves target for the rate of inflation is two percent. As long as the rate of inflation remains above that mark the Fed will continue to increase and/or maintain interest rates at a high level. Right now the reports are pointing at higher rates for a longer time. Several recent reports have shown that inflation is sticky to the upside. For instance last weeks personal consumption expenditures price index (the Feds Favorite gauge of inflation) excluding food and energy increased 0.6% for the month, and was up 4.7% from a year ago, the Commerce Department reported on Friday. Wall Street had been expecting respective readings of 0.5% and 4.4%. The core PCE gains were 0.4% and 4.6% in December. Including the volatile food and energy components, headline inflation increased 0.6% and 5.4% respectively, compared to 0.2% and 5.3% in December. Markets fell following the report, with the Dow Jones Industrial Average off around 500 points in Friday morning trading. “This morning’s strong inflation data continued the recent spate of market-unfriendly news. This could keep the policy rate higher for longer than the market had hoped, which in turn will likely pressure earnings,” said Matt Peron, director of research at Janus Henderson Investors. “While we do see signs that inflation will eventually moderate, higher rates for longer will take a toll.” Consumer spending also rose more than expected as prices increased, jumping 1.8% for the month vs. the estimate for 1.4%. Adjusted for inflation, prices rose 1.1%. Personal income adjusted for inflation increased 1.4%, higher than the 1.2% estimate. The personal saving rate also was up, rising to 4.7%. All of the numbers suggest inflation accelerated to start the new year, putting the Fed in a position where it likely will continue to raise interest rates. The central bank has pushed benchmark rates up by 4.5 percentage points since March 2022 as inflation hit its highest level in some 41 years. So there you have it those are the kind of reports that are moving the market. An example from the other side of the spectrum would be today’s Case-Shiller home market report which shows home prices easing. Higher mortgage rates weighed on home price gains at the end of 2022. While prices were still higher than they were a year earlier, the rate of increase slowed quickly, according to data released today. Home prices in December were 5.8% higher than the previous December, according to the S&P CoreLogic Case-Shiller U.S. National Home Price NSA Index. That is down from a 7.6% annual gain in November. Prices are now 4.4% below their June peak. For all of 2022, the 5.8% price gain was the 15th best performance in the index’s 35-year history, but was well below 2021′s record-setting 18.9% gain. The annual increase for the 10-city composite, which includes the New York and Los Angeles metro areas, was 4.4% in December, down from 6.3% in the previous month. The 20-city composite, which includes the Seattle and Dallas areas, marked a 4.6% year-over-year gain, down from 6.8% in the previous month. The skinny of it all is the Fed’s rate increases are starting to have the desired effect in that they are slowing the economy down. So after all is said and done, inflation is beginning to moderate but it is still high and there is a lot more work to be done. As far as I’m concerned that is to be expected, but as far as the market is concerned it’s viewed as a negative. Investors want inflation to go straight down and rates to return to prepandemic levels in short order. That might be the case in a perfect world but as we all know this is not a perfect world nor will it be until Jesus returns. So all economic reports must be goldilocks/ just right. They must be not too hot and not too cold. They must show that the inflation is cooling but that the economy is not slowing down so much that it is going into reverse (going into a recession). Anything that does not fit this just right template either causes the market to rally or sell off depending on how extreme the report is viewed to be. This buying and selling is the volatility that you see each day in the market and it will remain with us as long as inflation is high. That is the reason that you flat cannot pay attention to the short indicators right now. They have been and continue to be pushed around by the various economic reports that we see each week. The bottom line is that you must focus on the longer term indicators to see the overall trend. Are you seeing higher highs and higher lows? What is the overall trend? Right now believe it or not the trend is still moving higher. It’s very hard to see with all the buying and selling but it is. The problem with looking at the short term moves is that the market is taking three steps forward and two stops back and sometimes three steps back. This makes it very hard to focus on where you need to be. As we noted the past couple of weeks there is not a lot of money to be made now. Being in the market is more about being positioned for the next rally. We don’t know when that will be but we know it will move quickly once it starts. So as long as we can remained positioned and keep all or most of what we have we will stay invested in equities. For those of you rookies that is the C, S, and I funds. Also, while I’m on the subject, bonds are out right now. As long as interest rates trend higher they will trend lower. Thus, we will not be investing the F Fund anytime soon.
Todays trading is generating the following results: Our TSP allotment is currently up +0.55%. For comparison, the Dow is trading lower at -0.48%, the Nasdaq is flat at +0.02%, and the S&P 500 is off -0.10%.
Dow falls more than 100 points on Tuesday, deepening a February decline as interest rates jump: Live updates
Recent action has left us with the following signals: C-Sell, S-Hold, I-Hold, F-Sell. We are currently invested at 100/S. Our allocation is now +3.64% for the year not including today’s results. Here are the latest posted results:
| 02/27/23 | Prior Prices | ||||
| Fund | G Fund | F Fund | C Fund | S Fund | I Fund |
| Price | 17.3401 | 18.3009 | 61.2552 | 67.0634 | 35.9464 |
| $ Change | 0.0052 | 0.0331 | 0.1952 | 0.2111 | 0.4149 |
| % Change day | +0.03% | +0.18% | +0.32% | +0.32% | +1.17% |
| % Change week | +0.03% | +0.18% | +0.32% | +0.32% | +1.17% |
| % Change month | +0.27% | -2.65% | -2.15% | -1.65% | -2.33% |
| % Change year | +0.61% | +0.51% | +3.99% | +8.99% | +5.90% |
***Just a reminder that you can review the performance of our allocation at the Web Site TSPTALK.com in the autotracker section under the screen name KyFan1.