
Good Evening, It’s been a wild ride the last few days. The really crazy thing about it is how random the action has been. A lot of folks are complaining about the wild swings. First the market is coupled to oil then it is not. The only three things that have been consistent at all have been cash, bonds and gold. It has been a great time to be in the G or F Funds. You can bet though that they’ll be someone at the water cooler or in the break room that will say that we have reached the bottom. You know what? If they say it enough they will be eventually be correct. Just remember one thing, they lost a lot of money the other gazillion times they when said it was at the bottom while they chastised you for playing it safe. So I guess in a way, they paid for the privilege of being right for one day… Just watch your charts and do what you know is best and come retirement day, you’ll be they one that will be right. It I had to choose one day to be right, that would be it!
The days trading left us with the following results: Our TSP allotment was steady in the G fund. For comparison, the Dow added +0.49%, the Nasdaq +0.12%, and the S&P 500 +0.15%. Of course they were all down early in the session and came back to finish in the green.
U.S. stocks rise for second day; materials a boost
The days action left us with the following signals: C-Neutral, S-Neutral, I-Neutral, F-Buy. We are currently invested at 100/G. Our allocation is now +0.21% on the year not including the days results. Here are the latest posted results:
| 02/03/16 | Prior Prices | ||||
| Fund | G Fund | F Fund | C Fund | S Fund | I Fund |
| Price | 14.9463 | 17.2204 | 25.8348 | 31.5609 | 22.3293 |
| $ Change | 0.0008 | -0.0157 | 0.1372 | 0.1351 | 0.0984 |
| % Change day | +0.01% | -0.09% | +0.53% | +0.43% | +0.44% |
| % Change week | +0.02% | +0.08% | -1.38% | -1.87% | -1.81% |
| % Change month | +0.02% | +0.08% | -1.38% | -1.87% | -1.81% |
| % Change year | +0.21% | +1.57% | -6.27% | -10.43% | -7.33% |
| L INC | L 2020 | L 2030 | L 2040 | L 2050 | |
| Price | 17.5589 | 22.4505 | 23.9234 | 25.1528 | 14.1037 |
| $ Change | 0.0167 | 0.0506 | 0.0738 | 0.0899 | 0.0574 |
| % Change day | +0.10% | +0.23% | +0.31% | +0.36% | +0.41% |
| % Change week | -0.30% | -0.73% | -1.01% | -1.18% | -1.34% |
| % Change month | -0.30% | -0.73% | -1.01% | -1.18% | -1.34% |
| % Change year | -1.21% | -3.27% | -4.55% | -5.34% | -6.14% |
Lets take a look at the charts: (All signals annotated with Green Circles) If you click on the charts they will become larger!
C Fund: The Accum/Dist line is a great early predictor and it’s telling us that this one is probably going up! Specifically, it tells us that there is more buying (Accumulation) than selling (distribution). With this kind of money flowing into the C Fund it should head higher.
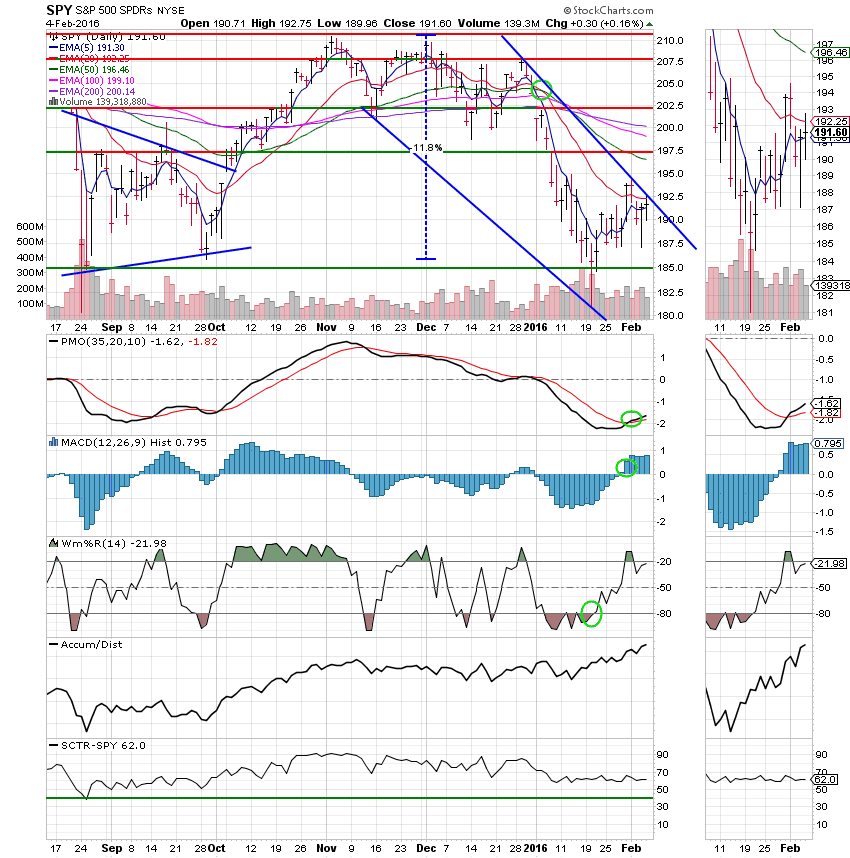
S Fund: The Accum/Dist line is predicting that the S Fund will move up!
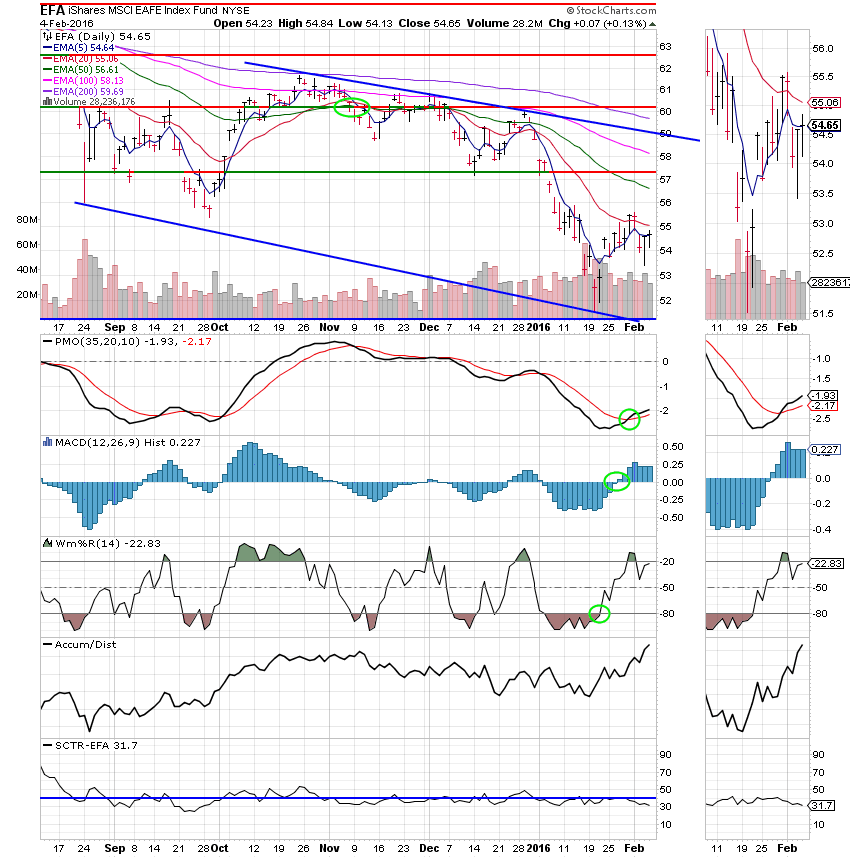
I Fund: Again, the Accum/Dist line is predicting upward movement!
F Fund: The F Fund is still moving up, but I have a few concerns. #1 The Accum/Dist line has been telling us that there has been money moving out of the F Fund and it looks like it’s going back stocks! #2 If the Fed increases interest rates it won’t be good for the F Fund. Taking those two things into account, I have made the decision to stay out of the F Fund even though it is working at the present time.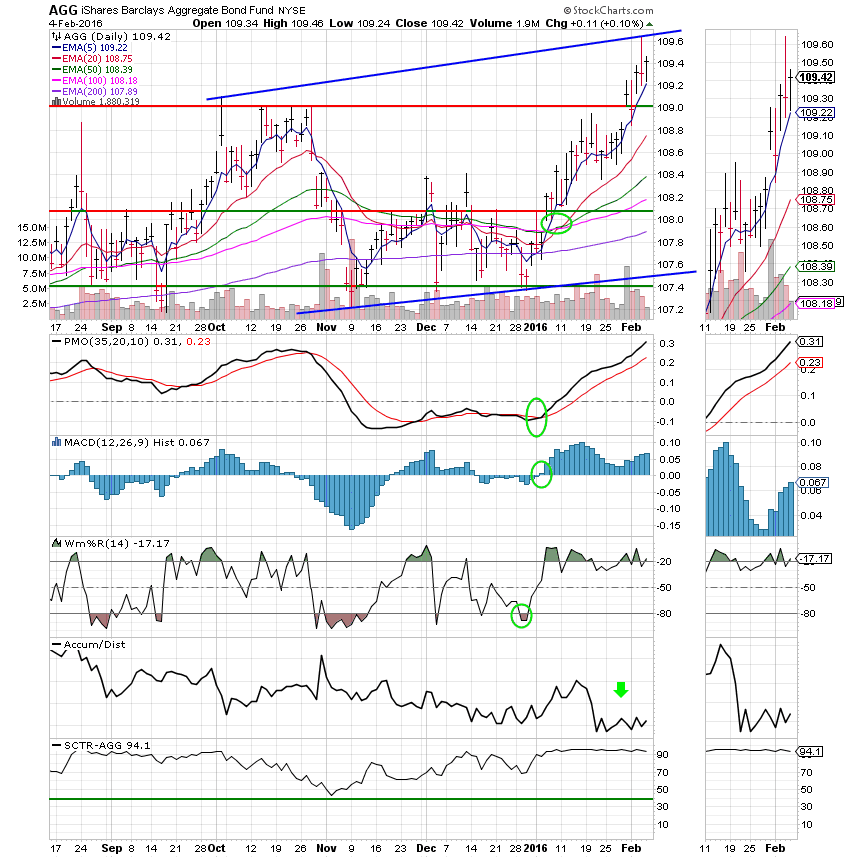
We need to focus our chart watch on price a the moment. If it improves and the other indicators stay the same, we may get a chance to get back into equities soon. I would be inclined to assume more risk due to the Accum/Dist line readings. That’s all for tonight. Stay patient!!!! Have a great evening and I’ll see you tomorrow!