
Good Evening, I been hammering away at the concept that we have to be patient. In the recent week we had a few nice countertrend rallies. When this happens the question inevitably comes up “The markets going back up, why aren’t we back in it??? Well, if you had to ask, this is why. Some of the best bounces come during bear markets and make no mistake, I said it before and I’ll say it again for anyone that wasn’t listening as I’m sure I have your attention now. This is a bear market!!! They’ll suck more buyers in and then give them some real pain. So, How do we avoid this?? By waiting until everything on our charts tells us that we can buy again. In today’s case, we had three indicators flashing buy signals, the PMO, MACD, and Williams %R. Things were starting to look promising, but promising doesn’t make money….only a market that rises does. In this case price was still on a solid sell signal. By the matter of fact it was upside down, meaning that the 200EMA > 100EMA > 50EMA > 20EMA > 5 EMA. In most cases I won’t even buy before the 50EMA passes back up though the 200 EMA. This is known as the golden cross in technical analysis. Of course the closer you get to having the opposite of the above example, the less risk you incur. There are a lot of additional factors that come into play when I consider getting into the market while the 50 EMA is still below the 200EMA. Without writing a book about it here, all of my other indicators have to be positive and a few fundamental things such as the cash flow in or out of bonds has to favor equities. Even then it’s a greater risk. The bottom line is this. The longer you wait the less risk you’ll incur. This is very hard to do when you see others making money so you really have to decide what your appetite for risk is. Then watch the charts and adjust your entry time accordingly.
Today the tech sector brought the market down. Stocks like Google and Amazon started catching up with everything else and not in a good way. When you have a bear market, eventually every sector sells off before you reach a bottom. Today it was tech and it was painful!!
The days selloff left us with the following results: Our TSP allotment was steady and safe in the G/Fund. For comparison, the Dow lost-1.29%, the Nasdaq -3.25% and the S&P 500 -1.85%. Praise God for guiding us to the G Fund!
Buckle Up: Stocks Crumple in Another Marketwide Selloff
The weeks action left us with the following signals: C-Neutral, S-Neutral, I-Neutral, F-Buy. We are currently invested at 100/G. Our allocation is now +0.21% on the year not including the days results. Here are the latest posted results:
| 02/04/16 | Prior Prices | ||||
| Fund | G Fund | F Fund | C Fund | S Fund | I Fund |
| Price | 14.947 | 17.2333 | 25.8789 | 31.7752 | 22.4166 |
| $ Change | 0.0007 | 0.0129 | 0.0441 | 0.2143 | 0.0873 |
| % Change day | +0.00% | +0.07% | +0.17% | +0.68% | +0.39% |
| % Change week | +0.02% | +0.15% | -1.21% | -1.20% | -1.43% |
| % Change month | +0.02% | +0.15% | -1.21% | -1.20% | -1.43% |
| % Change year | +0.21% | +1.64% | -6.11% | -9.82% | -6.97% |
| L INC | L 2020 | L 2030 | L 2040 | L 2050 | |
| Price | 17.5712 | 22.4849 | 23.9734 | 25.2143 | 14.143 |
| $ Change | 0.0123 | 0.0344 | 0.0500 | 0.0615 | 0.0393 |
| % Change day | +0.07% | +0.15% | +0.21% | +0.24% | +0.28% |
| % Change week | -0.23% | -0.58% | -0.80% | -0.94% | -1.07% |
| % Change month | -0.23% | -0.58% | -0.80% | -0.94% | -1.07% |
| % Change year | -1.14% | -3.12% | -4.35% | -5.11% | -5.88% |
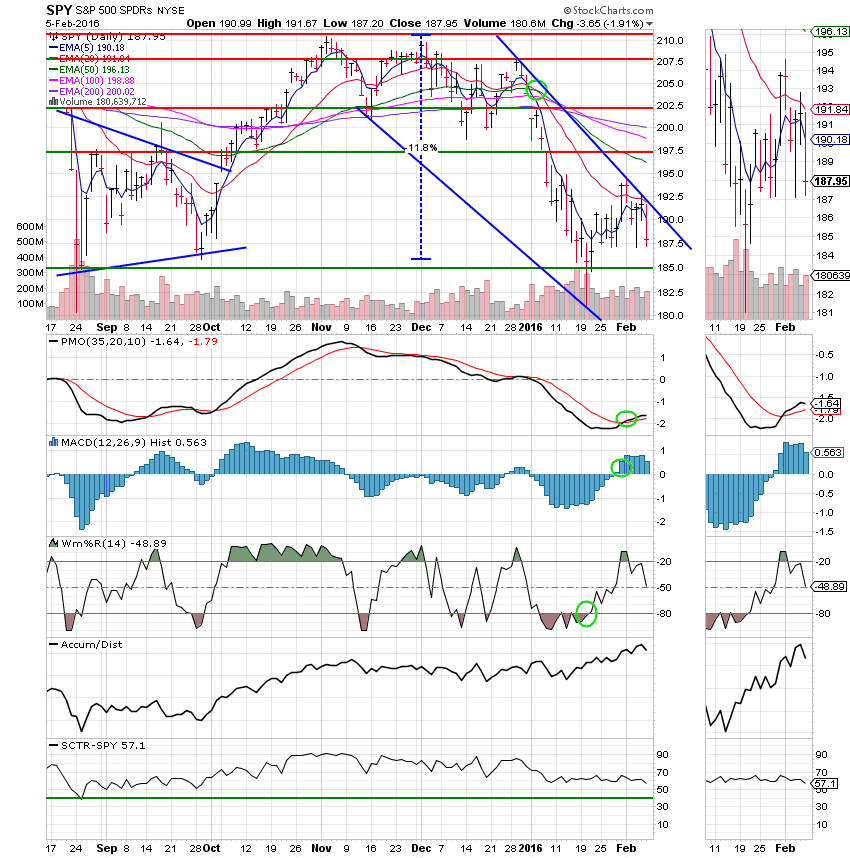
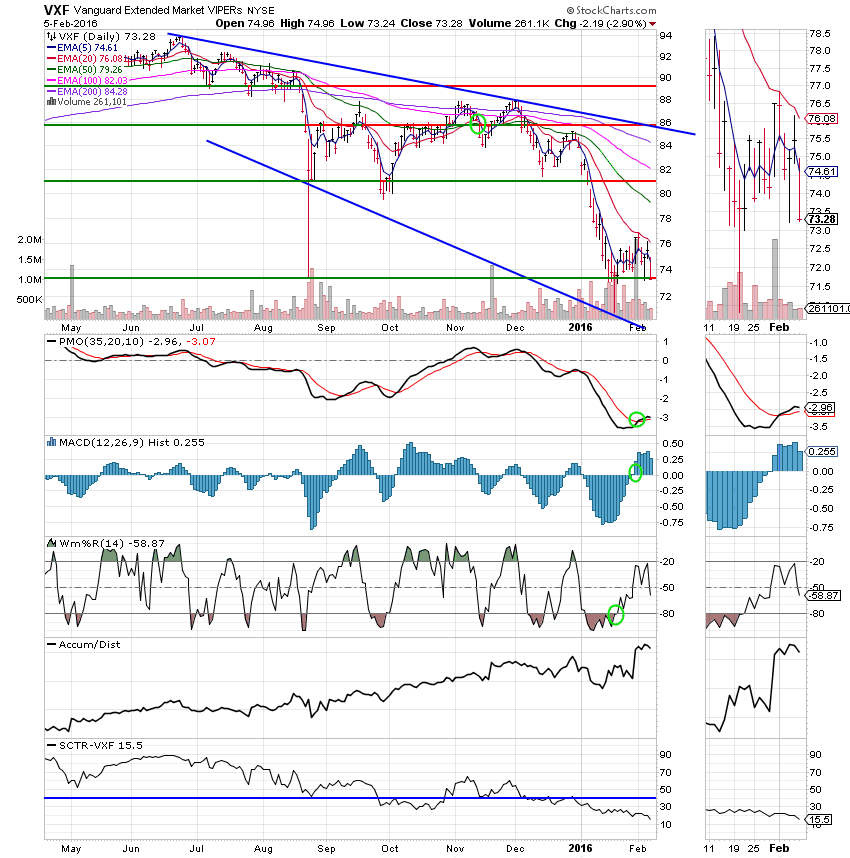
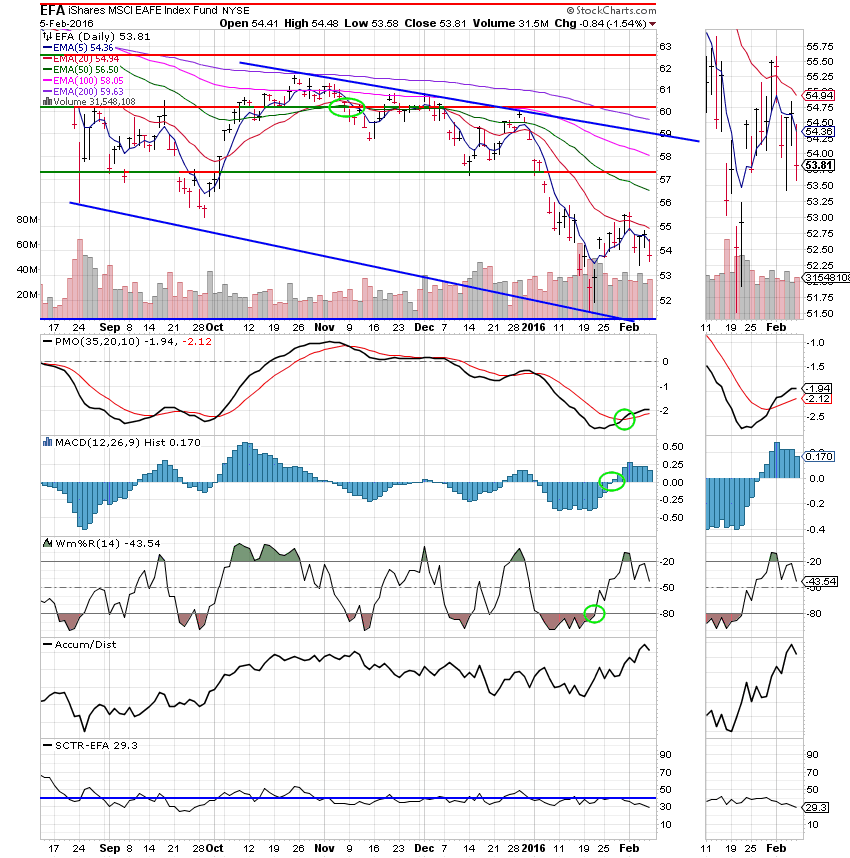
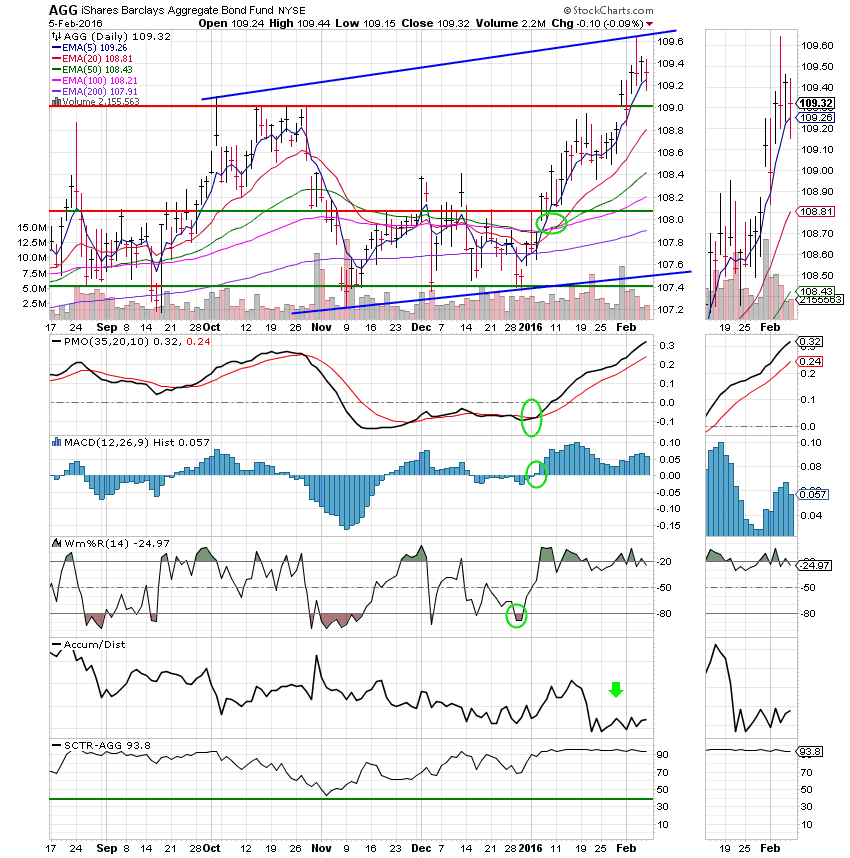
Lets take a look at the charts: (All signals annotated with Green Circles) If you click on the charts they will become larger!
C Fund:
S Fund: Small and Mid caps got absolutely hammered today!
I Fund:
F Fund:
Have faith! This too shall pass. It might just take a little longer than you think! You might as well watch some football this weekend. Thank God your Thrift account is safe! Have a great weekend and I’ll see you on Monday!