Good Evening, Is this a bottom or a bounce? It feels like a bounce to me. We are in a bear market until proven otherwise which means bear market rules apply and they say to sell into strength. The market rallied today and the media excuse was that a few OPEC and Non OPEC members got together and agreed to freeze oil production at January levels… whatever….. Nothing has fundamentally changed. Therefore, I have no reason to believe that this is a bottom.
The days action left us with the following results: Our TSP allotment was steady in the G Fund. For comparison, the Dow gained +1.39%, the Nasdaq + 2.27%, and the S&P 500 +1.65%. In a bear market, you must have a system and be disciplined. If this is indeed not a bottom, then want to do is rush in just because it’s exciting. In a system like ours where you follow the trend you will never find yourself fully invested when the market turns the corner. That’s insurance. That’s the price of doing business.
Wall St climbs again; consumer, industrial shares surge
The days action left us with the following signals: C-Neutral, S-Neutral, I-Sell, F-Buy. We are currently invested at 100/G. Our allocation is now +0.25% on the year not including the days results. Here are the latest posted results:
| 02/12/16 | Prior Prices | ||||
| Fund | G Fund | F Fund | C Fund | S Fund | I Fund |
| Price | 14.953 | 17.2698 | 25.2199 | 30.2349 | 21.3697 |
| $ Change | 0.0007 | -0.0783 | 0.4851 | 0.5957 | 0.3167 |
| % Change day | +0.00% | -0.45% | +1.96% | +2.01% | +1.50% |
| % Change week | +0.04% | +0.17% | -0.72% | -1.96% | -3.60% |
| % Change month | +0.06% | +0.36% | -3.73% | -5.99% | -6.03% |
| % Change year | +0.25% | +1.86% | -8.50% | -14.19% | -11.31% |
| L INC | L 2020 | L 2030 | L 2040 | L 2050 | |
| Price | 17.4557 | 22.1198 | 23.4336 | 24.5497 | 13.7162 |
| $ Change | 0.0590 | 0.1827 | 0.2661 | 0.3242 | 0.2069 |
| % Change day | +0.34% | +0.83% | +1.15% | +1.34% | +1.53% |
| % Change week | -0.31% | -0.79% | -1.11% | -1.31% | -1.51% |
| % Change month | -0.89% | -2.19% | -3.04% | -3.55% | -4.05% |
| % Change year | -1.79% | -4.69% | -6.50% | -7.61% | -8.72% |
Lets take a look at the charts: (All signals annotated with Green Circles) If you click on the charts they will become larger!
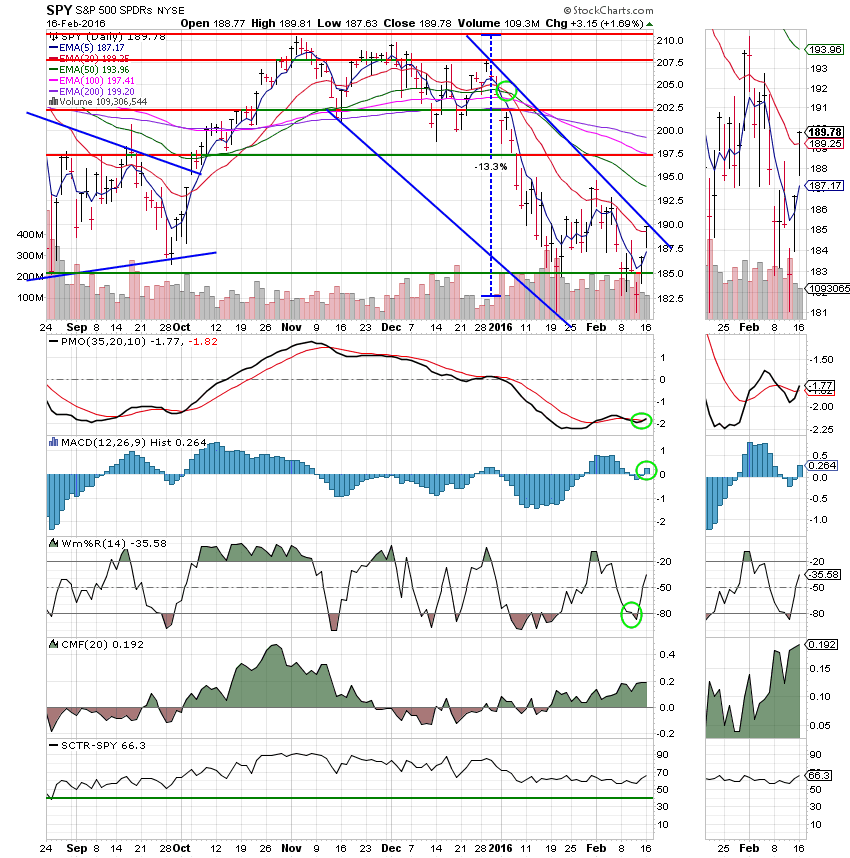
C Fund: The C Fund generated an overall neutral signal today when the PMO and MACD moved into positive configurations.
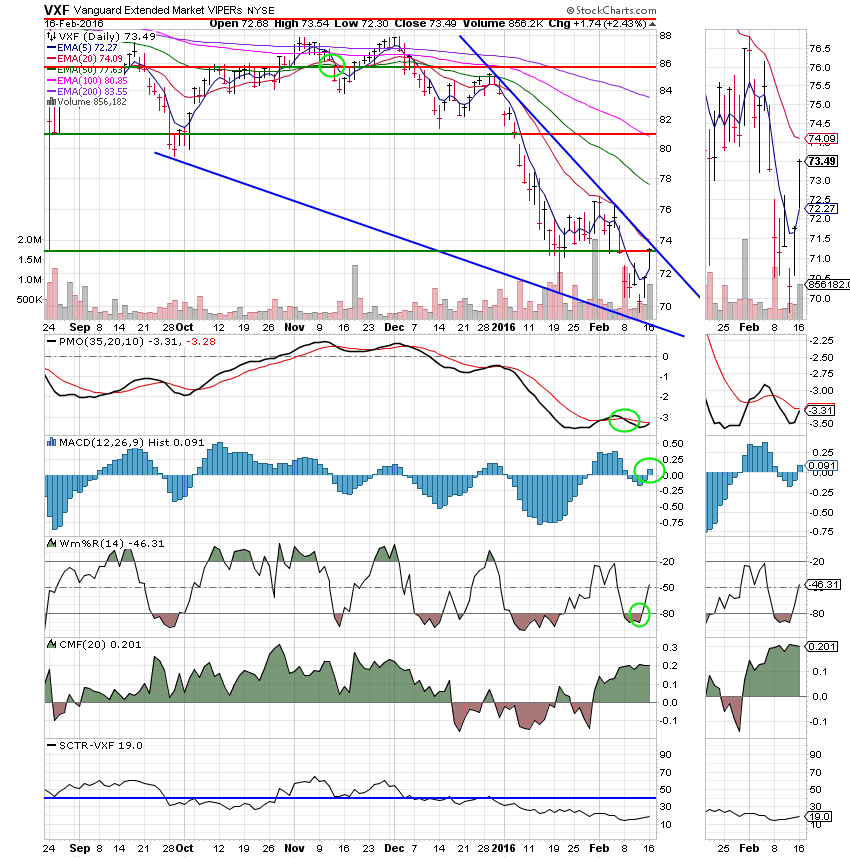
S Fund: The S Fund generated an overall neutral signal when the MACD moved into a positive configuration.
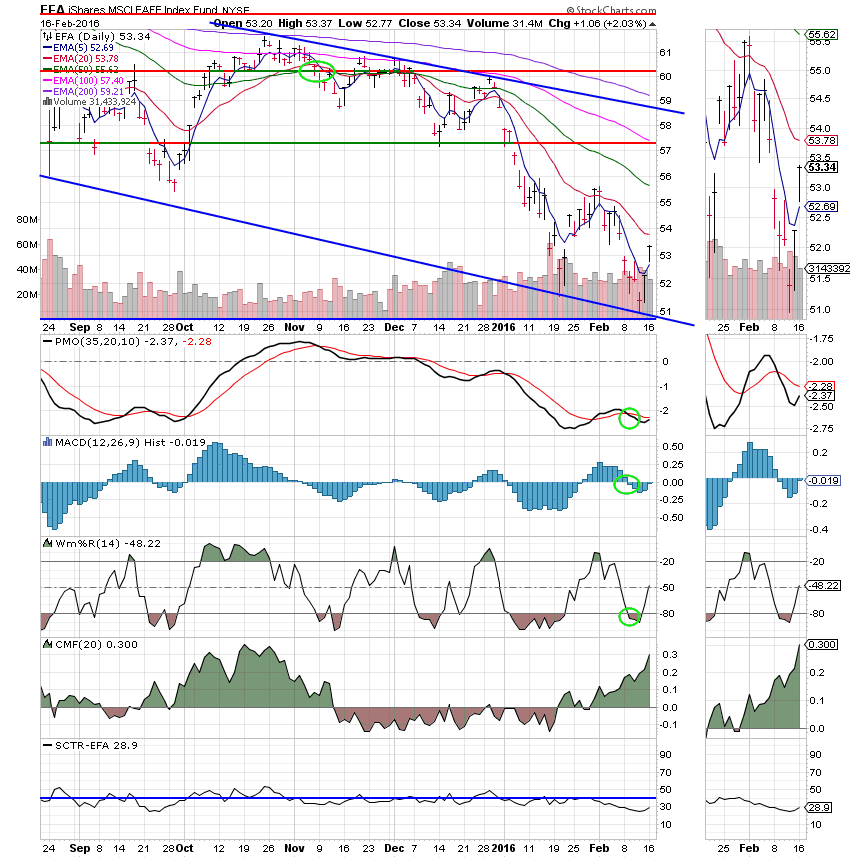
I Fund:
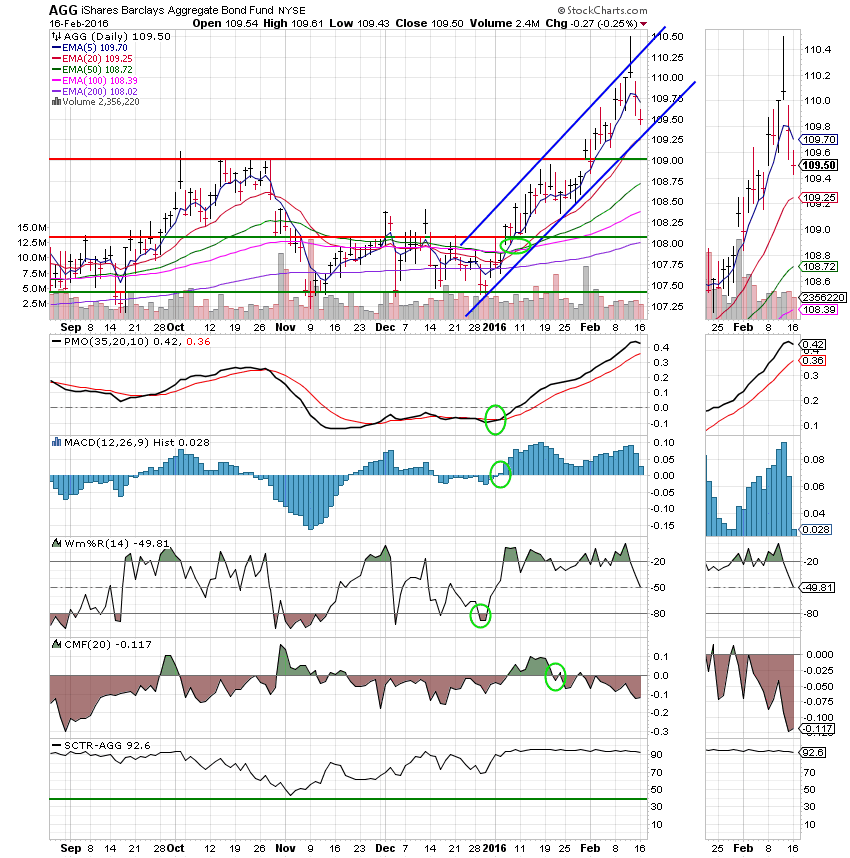
F Fund: The F Fund is still on a buy signal, but is starting to feel a little selling pressure with the positive action in stocks. The CMF shows money heading out of bonds. So how long can they stay afloat?
It will take a lot more than a two day bounce to repair all this damage. For now it’s still a bear! Have a nice evening and may God continue to bless your trades.


