Good Evening, Yes we are still 100/G. I will admit that things are looking more promising than they have been in recent weeks. However, promising doesn’t always turn into results. In this business you must be patient. If you are not capable of doing that, then you’d better turn your money over to someone else. Definitely, things are improving. Definitely, they aren’t there yet!
After three of the best days that we’ve had in a long while, the market decided to pull back today. Oil pulled back slightly. So I guess that can receive the blame…… The trading left us with the following signals: Our TSP allotment was steady in the G Fund. For comparison, the Dow was off -0.25%, the Nasdaq -1.03%, and the S&P 500 -0.47%.
Wal-Mart, oil drag Wall Street after three-day rally
The days action left us with the following signals: C-Neutral, S-Neutral, I-Neutral, F-Buy. We are currently invested at 100/G. Our allocation is now +0.28% on the year not including the days results. Here are the latest posted results:
| 02/17/16 | Prior Prices | ||||
| Fund | G Fund | F Fund | C Fund | S Fund | I Fund |
| Price | 14.9569 | 17.2343 | 26.0707 | 31.5643 | 22.1939 |
| $ Change | 0.0008 | -0.0263 | 0.4259 | 0.6000 | 0.3980 |
| % Change day | +0.01% | -0.15% | +1.66% | +1.94% | +1.83% |
| % Change week | +0.03% | -0.21% | +3.37% | +4.40% | +3.86% |
| % Change month | +0.09% | +0.16% | -0.48% | -1.86% | -2.41% |
| % Change year | +0.28% | +1.65% | -5.41% | -10.42% | -7.89% |
| L INC | L 2020 | L 2030 | L 2040 | L 2050 | |
| Price | 17.5856 | 22.5035 | 23.9886 | 25.2247 | 14.145 |
| $ Change | 0.0613 | 0.1843 | 0.2675 | 0.3258 | 0.2072 |
| % Change day | +0.35% | +0.83% | +1.13% | +1.31% | +1.49% |
| % Change week | +0.74% | +1.73% | +2.37% | +2.75% | +3.13% |
| % Change month | -0.15% | -0.50% | -0.74% | -0.89% | -1.05% |
| % Change year | -1.06% | -3.04% | -4.29% | -5.07% | -5.87% |
Lets take a look at the charts: (All signals annotated with Green Circles) If you click on the charts they will become larger!
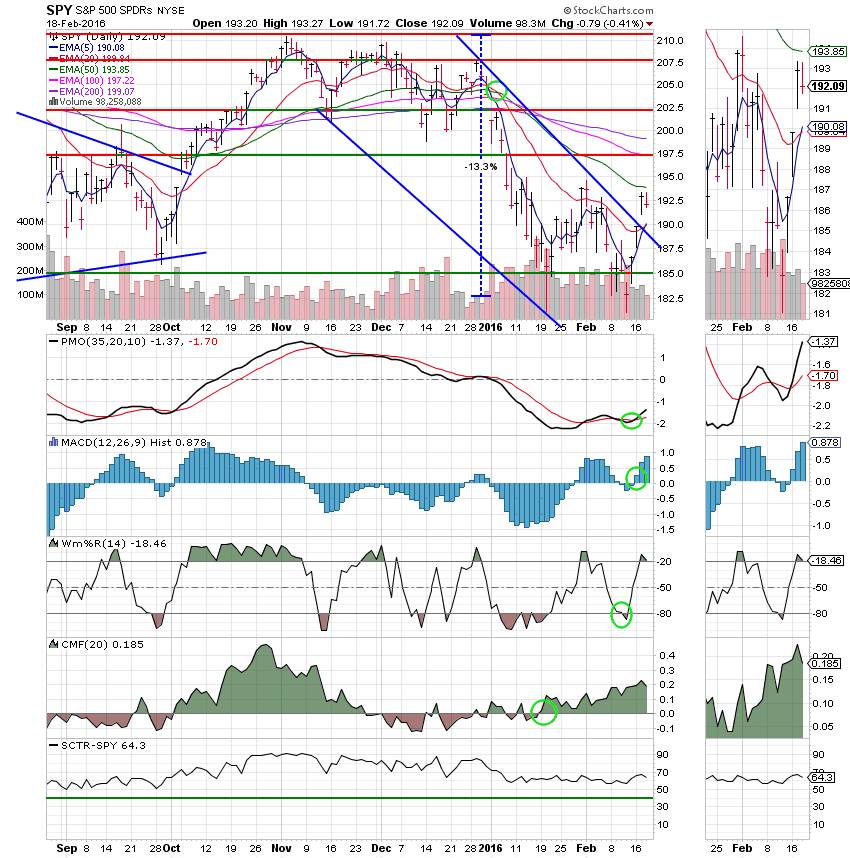
C Fund: Price traded for the second day above it’s upper trend line. The 5 EMA passed up through the 20 EMA. A little improvement, but not much to get excited about just yet.
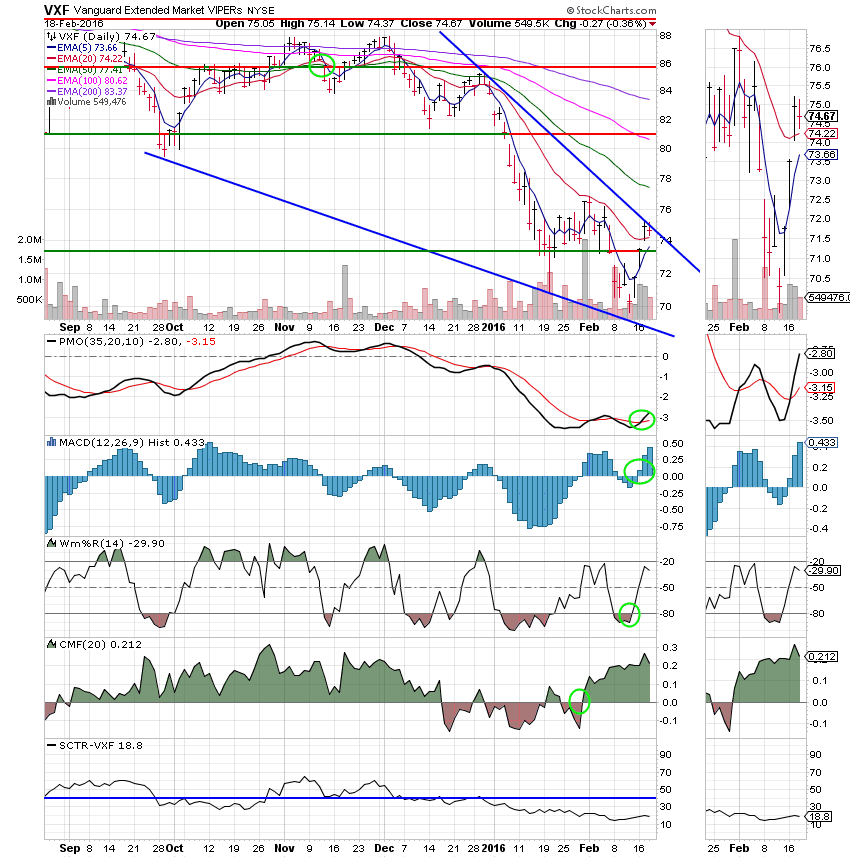
S Fund: Price tested the upper trend line but remains within the descending wedge pattern.
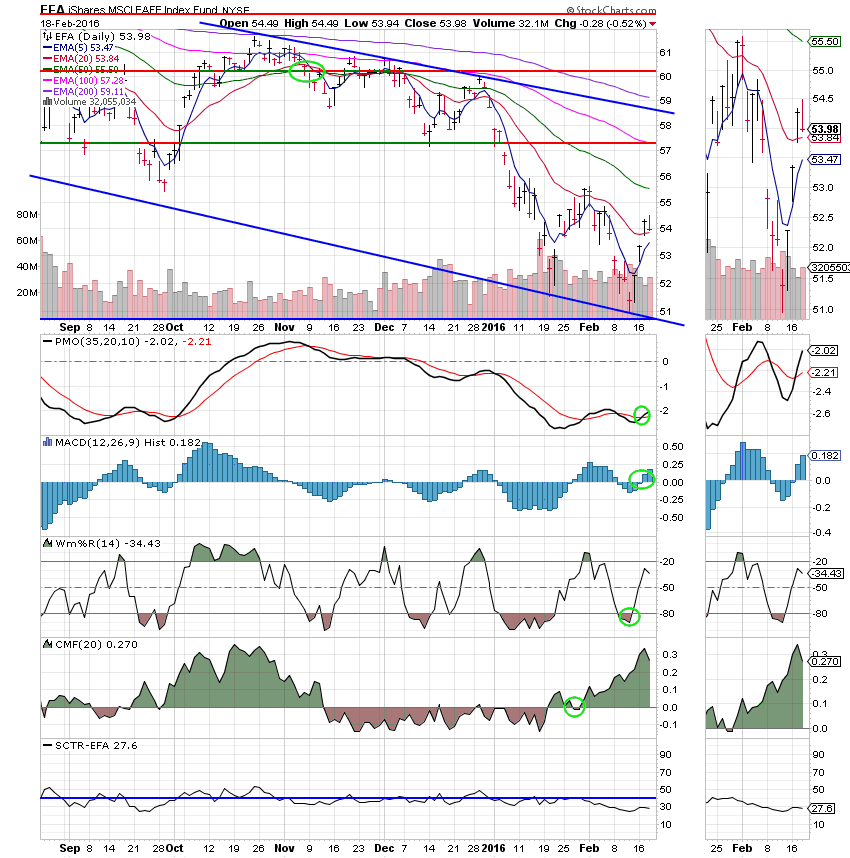
I Fund: Nothings really changed here.
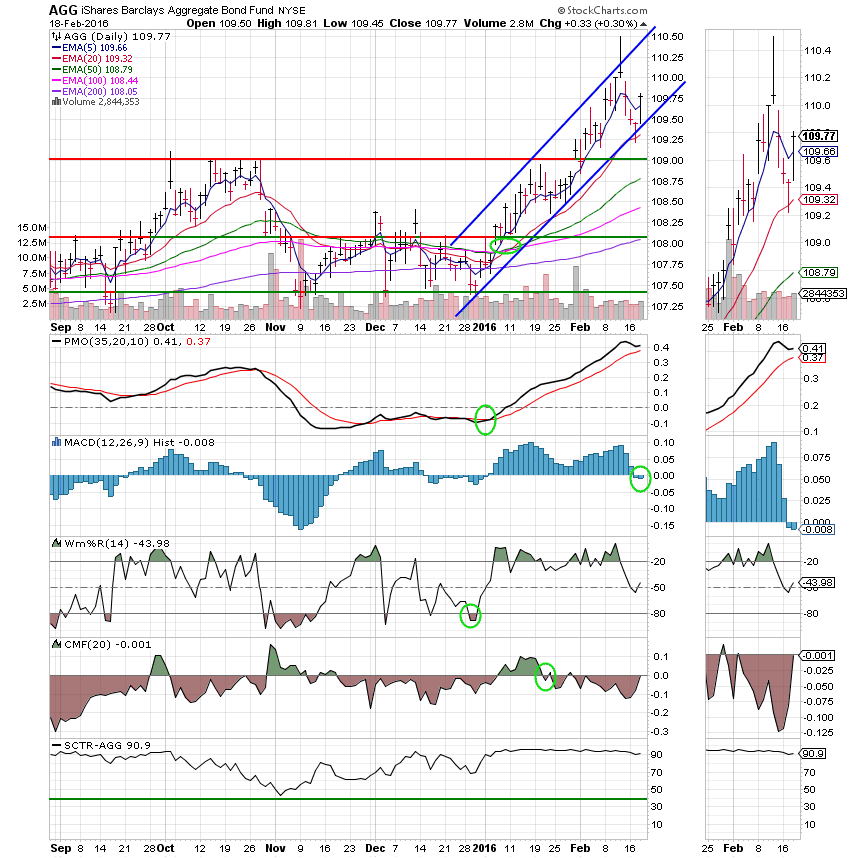
F Fund: Price remains firmly entrenched in the established ascending channel. However, this one is a little over bought. Also showing a little weakness on the chart is the MACD which moved into a negative configuration.
Folks, it’s a waiting game now. The charts have shown that they could be bottoming, but they haven’t done enough for us to risk our precious capital just yet. As I mentioned earlier, this is a game of patience and discipline. You must have both. Keep praying and God will keep blessing! Have a great evening!
God bless, Scott ![]()


