
Good Evening, Oil slumped in the morning and so did the market. Oil rebounded in the afternoon and the market experience a big intraday reversal to close well in the green. I don’t know how long the market is going to trade in lockstep with oil but one thing that I do know is that it won’t do it forever. Right now it appears that the S&P 500 is in a trading range between 1940 and 1850. I expect it will continue to trade in that range until it breaks through resistance or support. Exactly when that will occur, I can’t say. However, when it does you will have a pretty good idea where things are heading in the intermediate term.
The reversal left us with the following results: Our TSP allotment was steady in the G Fund. For comparison, the Dow gained +0.32%, the Nasdaq +0.87%, and the S&P 500 +0.44%.
Oil Maintains Grip on Stocks in Topsy-Turvy Trading
The days action left us with the following signals: C-Neutral, S-Neutral, I-Neutral, F-Buy. We are currently invested at 100/G. Our allocation is now +0.31% on the year not including the day’s results. Here are the latest posted results:
| 02/23/16 | Prior Prices | ||||
| Fund | G Fund | F Fund | C Fund | S Fund | I Fund |
| Price | 14.9614 | 17.3125 | 26.0026 | 31.6396 | 21.9771 |
| $ Change | 0.0007 | 0.0196 | -0.3256 | -0.3110 | -0.3112 |
| % Change day | +0.00% | +0.11% | -1.24% | -0.97% | -1.40% |
| % Change week | +0.02% | +0.10% | +0.19% | +0.44% | -0.38% |
| % Change month | +0.12% | +0.61% | -0.74% | -1.62% | -3.36% |
| % Change year | +0.31% | +2.11% | -5.66% | -10.21% | -8.79% |
| L INC | L 2020 | L 2030 | L 2040 | L 2050 | |
| Price | 17.5799 | 22.4693 | 23.935 | 25.1579 | 14.101 |
| $ Change | -0.0426 | -0.1313 | -0.1918 | -0.2338 | -0.1488 |
| % Change day | -0.24% | -0.58% | -0.79% | -0.92% | -1.04% |
| % Change week | +0.03% | +0.04% | +0.05% | +0.05% | +0.06% |
| % Change month | -0.18% | -0.65% | -0.96% | -1.16% | -1.36% |
| % Change year | -1.09% | -3.19% | -4.50% | -5.32% | -6.16% |
Now lets take a look at the charts. If you click on the charts they will become larger. All signals are annotated with Green Circles.
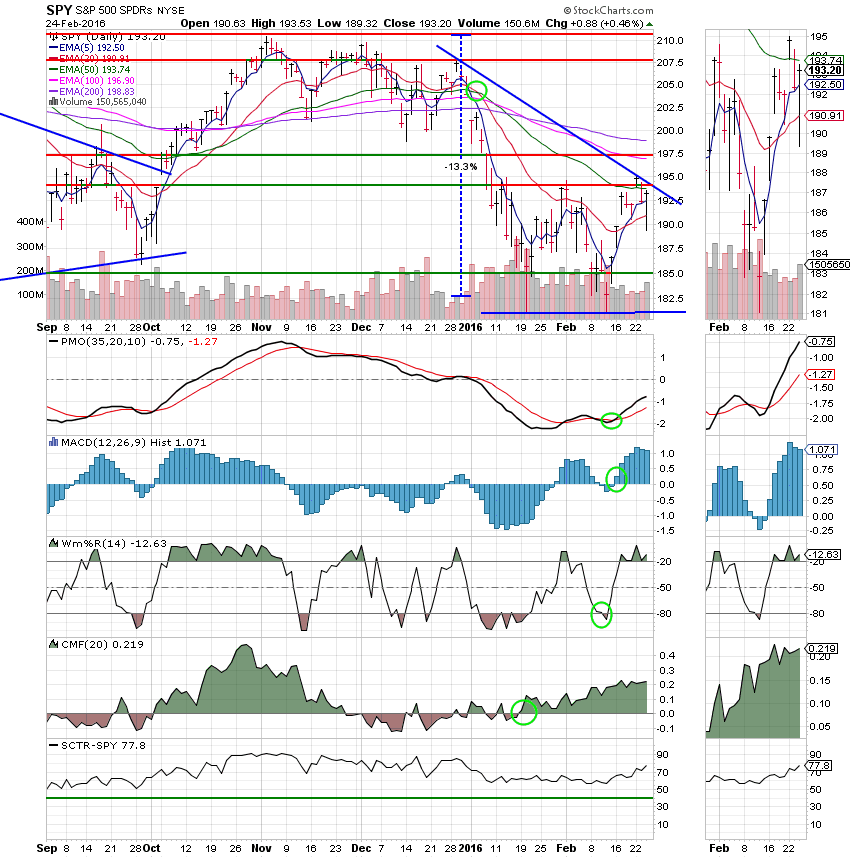
C Fund: Price still closed below it’s 50 EMA. While this chart is improving slowly, it’s still not enough to buy. However, the CMF shows that money is flowing into this fund.
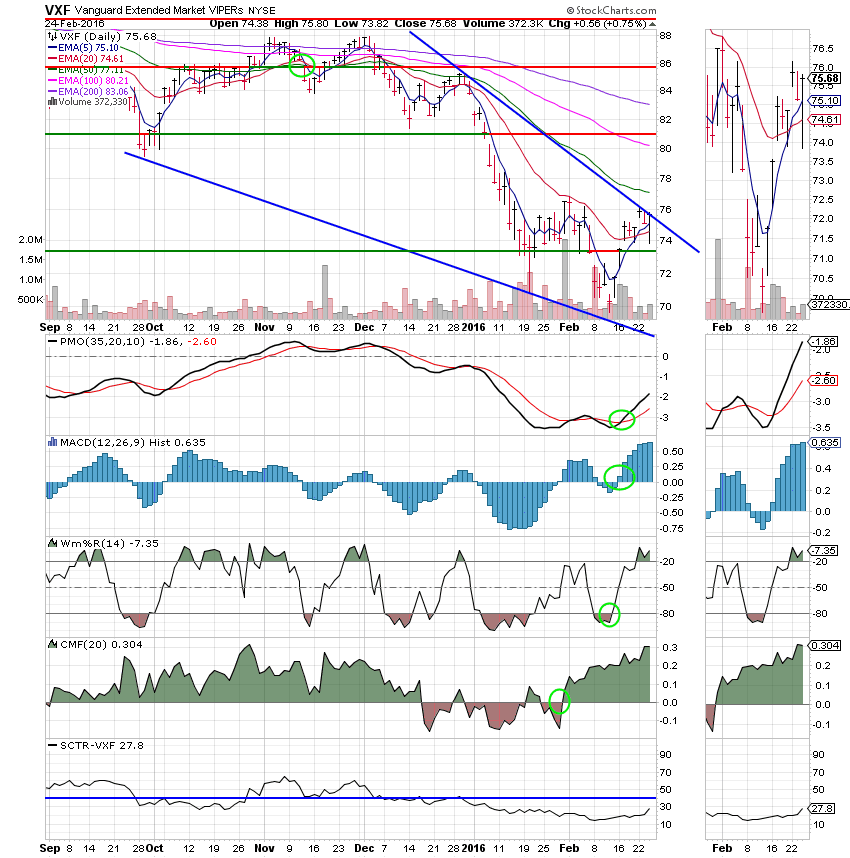
S Fund:
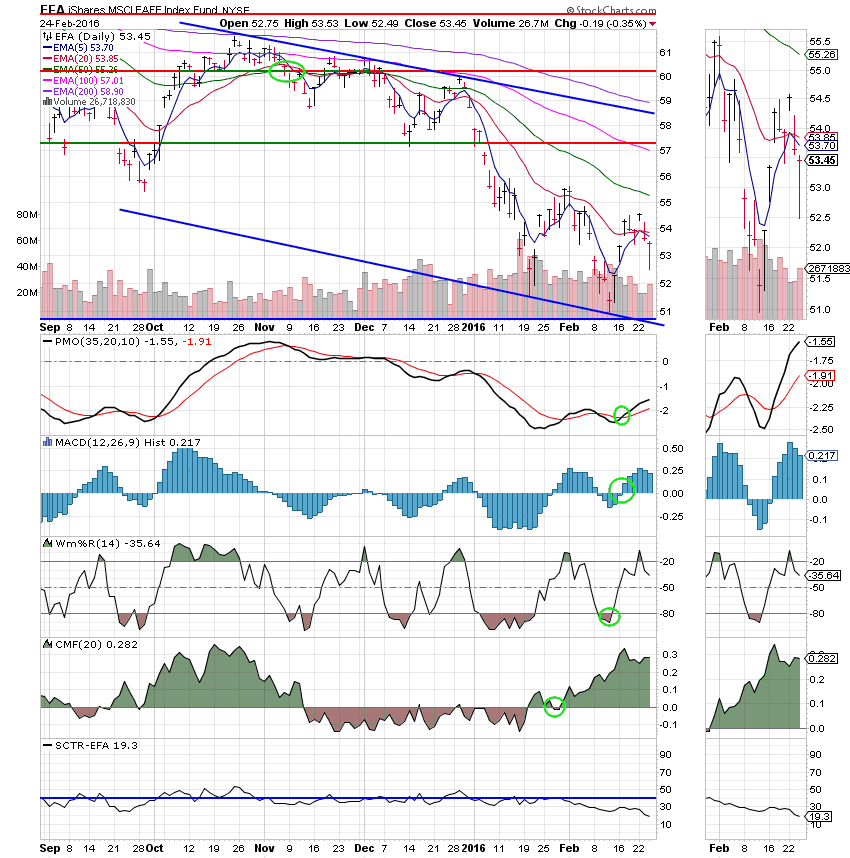
I Fund:
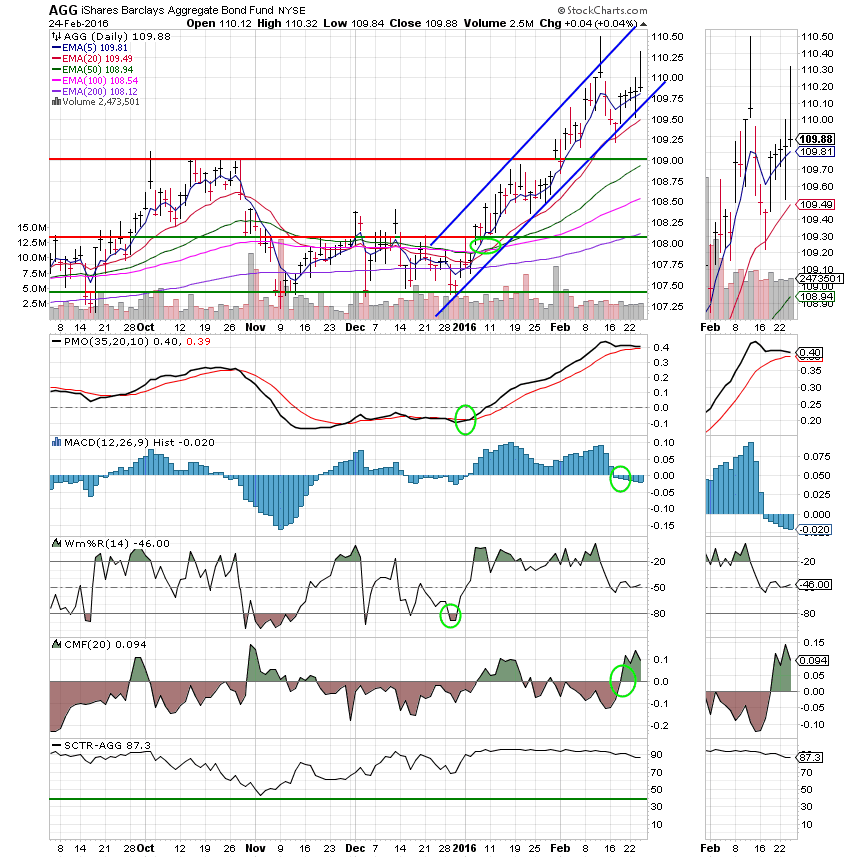
F Fund: The F Fund is starting to look a little overbought as evident by the PMO which has flattened out in oversold territory. The SCTR has reflected the weakness as it dropped slightly to 87.3.
The charts are improving slightly, but not enough to buy just yet, There will be plenty of time to board the train before it leaves the station! That’s all for tonight. Have a nice evening.