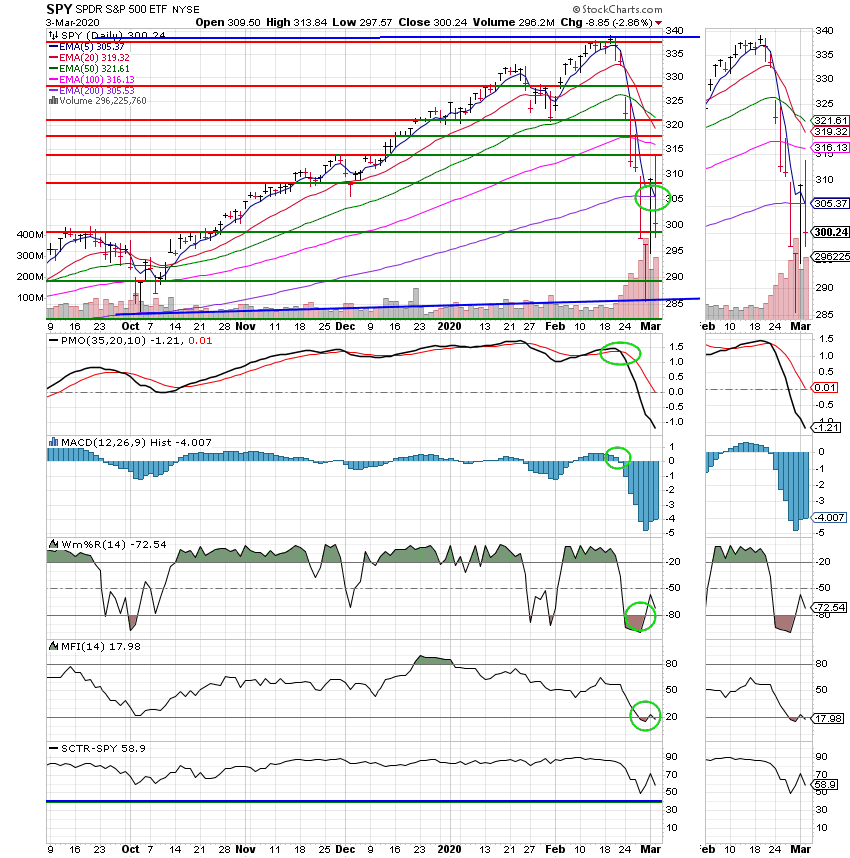
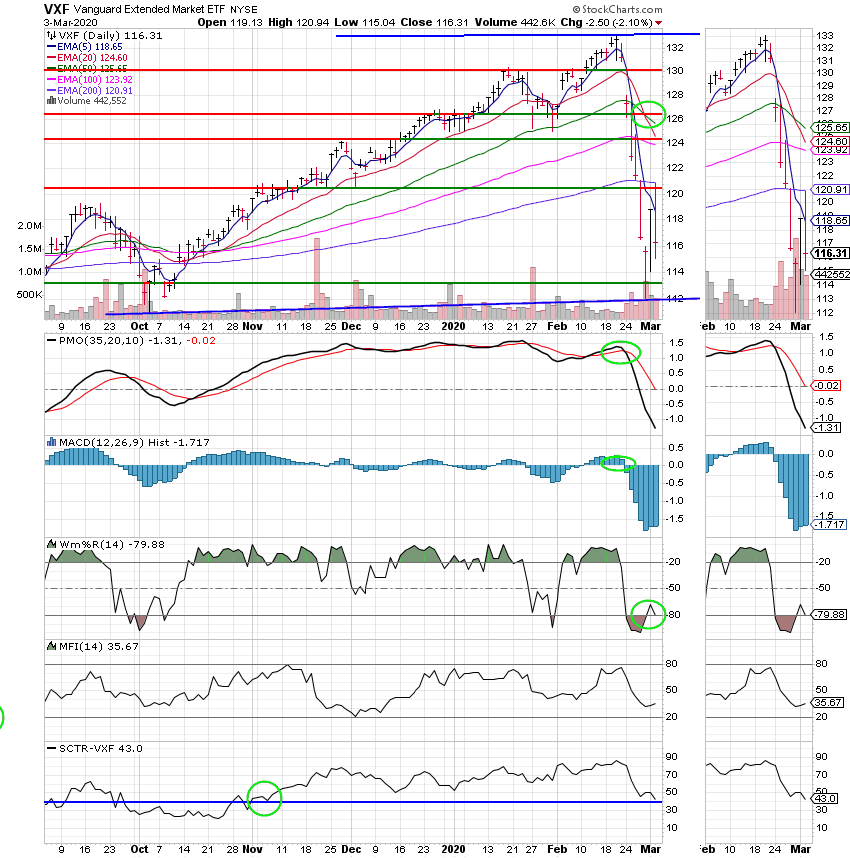
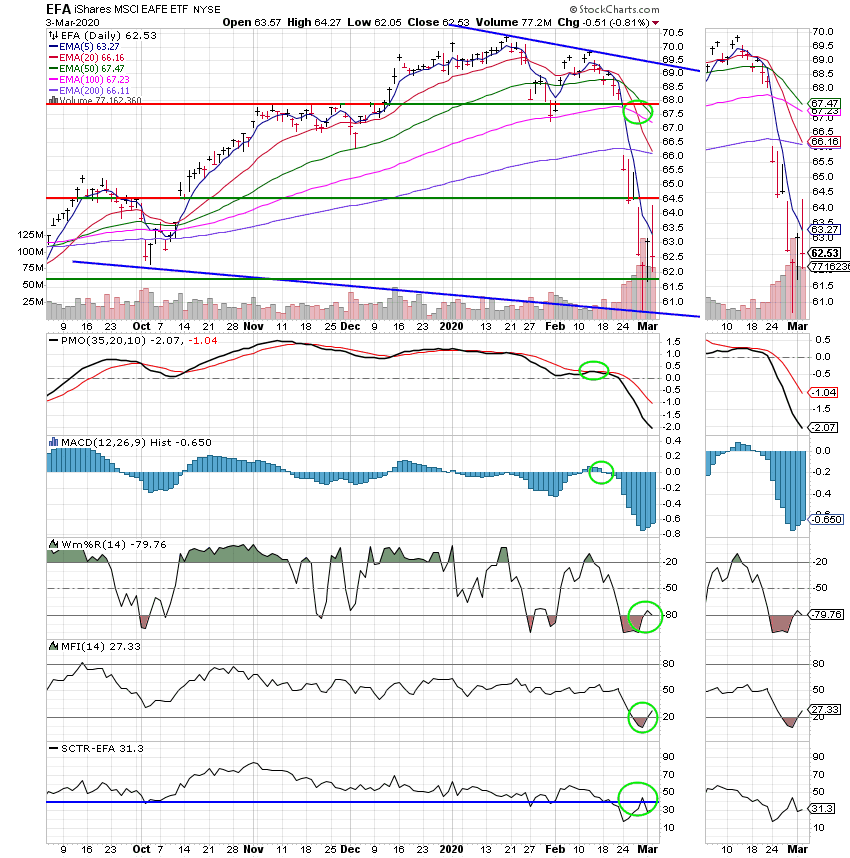
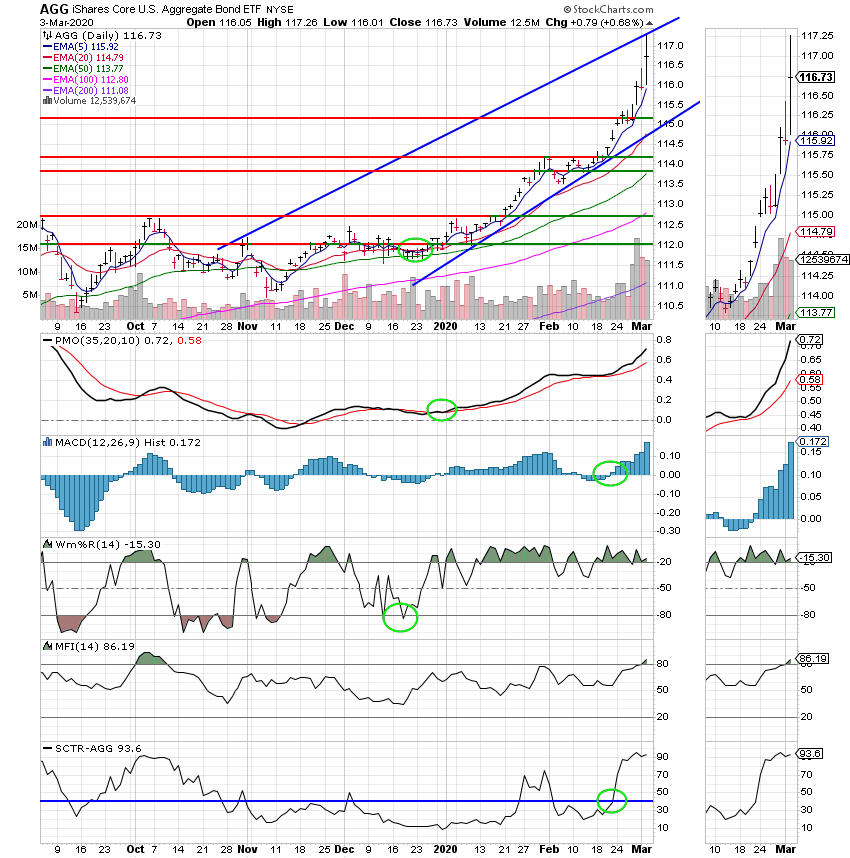
Good Evening, How many of you wished you were in the market yesterday? Now, how many wished they were in today? Folks that’s what volatility looks like when the volatility index ($VIX) is sitting at 36.82. You should expect big swings and a lot of negative action. So lets break it down. Yesterday market players decided that the Corona Virus sell off was over done with all the major indices in correction territory after only a week. I might add that it felt like a month! I am told that the drop was the fastest in the history of the market and Thursdays action was the biggest single day drop since 2008. Well you get the picture. It was bad and as far as investors were concerned overdone. I was expecting a dead cat bounce but I must admit that I was taken back by the size yesterday’s rally. It definitely had me wondering if we might be experiencing another V Shaped recovery that has become quite commonplace since 2008. Not to chase rabbits but I can remember only two or three V shaped bounces in my entire investing career prior to 2008. We have discussed all this before but the root of it all was the combination of cheap money and high speed computer trading. Look back in the archives if you want a more detailed explanation. At any rate, I even nibbled at some Apple and Microsoft on the street. Nonetheless, the turkeys came to roost today. For a while it looked like the V shaped bounce was in full swing when I glanced at my phone and saw the report of a surprise 0.5% rate cut by the Fed. I thought to myself ‘They weren’t playing. This market will fly’. What a surprise when the market players decided that the Feds cheap money might not be enough to offset an economy with broken supply chains and consumers and workers staying home. I swear they create things to worry about! So what do I think? Lets go back to my purchase of Microsoft and Apple. Of course I bought them for the charts. That’s what I do! But generally when I buy something I usually check to see if the fundamentals support my technical analysis. When I checked both of these companies (which are the two largest companies in the world by market cap) I noticed that they both stated that their supply chains in China were returning to normal. A close check of the headlines indicated that the amount of corona virus cases being reported in China was significantly dropping and folks there where returning back to work. That tells me that things may get a little worse here and around the world before they get better but they will get better. There is light at the end of the tunnel. Those that keep their powder dry are going to have the opportunity to make some real money. It took China about three months to start recovering from the out break. Yes there’s going to be some economic impact but if there’s one thing I’ve learned in my investing career it is that you don’t fight the Fed! The bottom line is that we just had a half point interest rate cut and we’re probably looking at another quarter point cut in the month. When things start to recover and they will recover there’s going to be a ton of cheap capital to fuel the recovery. I don’t know about you but I want to be ready and waiting for that run and it doesn’t matter to me if I’m right on time for the party or perhaps just a little late. I just want a piece the cake and their will be plenty of it to go around. So what’s our task now? It was fun talking about the fundamentals. However, we are technical analysts and we will watch our charts. When and only when they tell us it is safe to move back to equities will we do so. Irregardless of the fundamentals…. I have about forty charts I monitor on a daily basis which I use to determine when I get in and out of the market. I prefer that if not all then at least most of them give the all clear before I move back into equities. That is the reason that some folks wonder why I don’t just jump back in. It is because I am managing risk. As you have often heard me say this isn’t a casino. It’s retirement money….. never ever forget that……..
The days trading left us with the following results: Our TSP allotment was stable in the G Fund. For comparison, the Dow fell -2.94%, the Nasdaq -2.99%, and the S&P 500 -2.81%. That gave up a lot of yesterdays gains.
The days action left us with the following signals: C-Sell, S-Sell, I-Sell, F-Buy. We are currently invested at 100/G. Our allocation is now -3.26% on the year not including the days results. Here are the latest posted results.
| 03/02/20 | Prior Prices | ||||
| Fund | G Fund | F Fund | C Fund | S Fund | I Fund |
| Price | 16.4001 | 20.4879 | 45.3408 | 53.0054 | 29.8197 |
| $ Change | 0.0014 | 0.0273 | 1.9929 | 1.5555 | 0.4572 |
| % Change day | +0.01% | +0.13% | +4.60% | +3.02% | +1.56% |
| % Change week | +0.01% | +0.13% | +4.60% | +3.02% | +1.56% |
| % Change month | +0.01% | +0.13% | +4.60% | +3.02% | +1.56% |
| % Change year | +0.30% | +3.91% | -4.06% | -5.81% | -8.85% |
| L INC | L 2020 | L 2030 | L 2040 | L 2050 | |
| Price | 21.0169 | 29.0242 | 33.7431 | 36.9262 | 21.4571 |
| $ Change | 0.1512 | 0.2364 | 0.6596 | 0.8552 | 0.5619 |
| % Change day | +0.72% | +0.82% | +1.99% | +2.37% | +2.69% |
| % Change week | +0.72% | +0.82% | +1.99% | +2.37% | +2.69% |
| % Change month | +0.72% | +0.82% | +1.99% | +2.37% | +2.69% |
| % Change year | -0.80% | -0.97% | -3.18% | -3.91% | -4.56% |


