Good Evening,
I was wrong; the jobs report came in much better than expected this morning. Traders decided that the good news was in fact bad news as they surmised that it would lead to a FED rate increase and you already know the rest. The market sold off, causing some technical damage to our charts. We’ll look at those in a minute. Let’s stay on task for now. The question we have to ask ourselves: is this more consolidation or is this a top forming? Unfortunately, there is no simple answer to this question. If there were, then more than 15% of fund managers would have performed as well as the S&P 500 in 2014. Did I tell you how glad I am that year is over? Anyway, let’s take a look the facts. While the market has been a bit oversold, that is no longer the case. Also, February through March is the strongest period for the market seasonally. We still have the positive influence of cheap oil putting a lot of money back in the pockets of the consumer. Although they haven’t spent it yet, they will. So what! if they raise interest rates! We are still at historic lows. It’s not like we are going from near zero to 10% in one day. How about unemployment? With unemployment at just 5.5% we now have more people back to work than we have had in quite a while. What’s not to like about this economy? Yes, I’m laying fundamentals out and I’m a technical analyst, but fundamentals do have their place. In this case, they support our charts not having sell signals just yet. Let’s see how much damage the day’s trading actually did…
Our TSP allotment slid back -1.34% and AMP dropped -1.228%. For comparison the Dow (Apple will replace AT&T in this index later this month) lost -1.54%, the Nasdaq -1.11%, The S&P -1.42%, AT&T was -1.53%, Alaska Air Group -1.41%, Facebook -1.48%, and Apple gained +0.15%. I thank God the sell off wasn’t worse and also that we gained enough in the last month to keep us floating through this dip!
Wall Street ends lower as jobs data may bring rate hike sooner
The day’s action left us with the following signals:C-Neutral, S-Neutral, I-Neutral, F-Neutral. We are currently invested at 30/C, 34/S, 36/I. Our allocation is now +1.22% for the year. Here are the latest posted results:
| 03/06/15 | |||||
| Fund | G Fund | F Fund | C Fund | S Fund | I Fund |
| Price | 14.6656 | 16.832 | 27.4398 | 37.3845 | 25.4923 |
| $ Change | 0.0007 | -0.0993 | -0.3909 | -0.4848 | -0.2340 |
| % Change day | +0.00% | -0.59% | -1.40% | -1.28% | -0.91% |
| % Change week | +0.03% | -1.01% | -1.53% | -1.05% | -1.85% |
| % Change month | +0.03% | -1.01% | -1.53% | -1.05% | -1.85% |
| % Change year | +0.34% | +0.18% | +1.01% | +3.00% | +5.26% |
| L INC | L 2020 | L 2030 | L 2040 | L 2050 | |
| Price | 17.5823 | 23.2442 | 25.2655 | 26.9283 | 15.3108 |
| $ Change | -0.0501 | -0.1538 | -0.2148 | -0.2633 | -0.1669 |
| % Change day | -0.28% | -0.66% | -0.84% | -0.97% | -1.08% |
| % Change week | -0.35% | -0.83% | -1.06% | -1.20% | -1.34% |
| % Change month | -0.35% | -0.83% | -1.06% | -1.20% | -1.34% |
| % Change year | +0.75% | +1.51% | +1.85% | +2.08% | +2.35% |
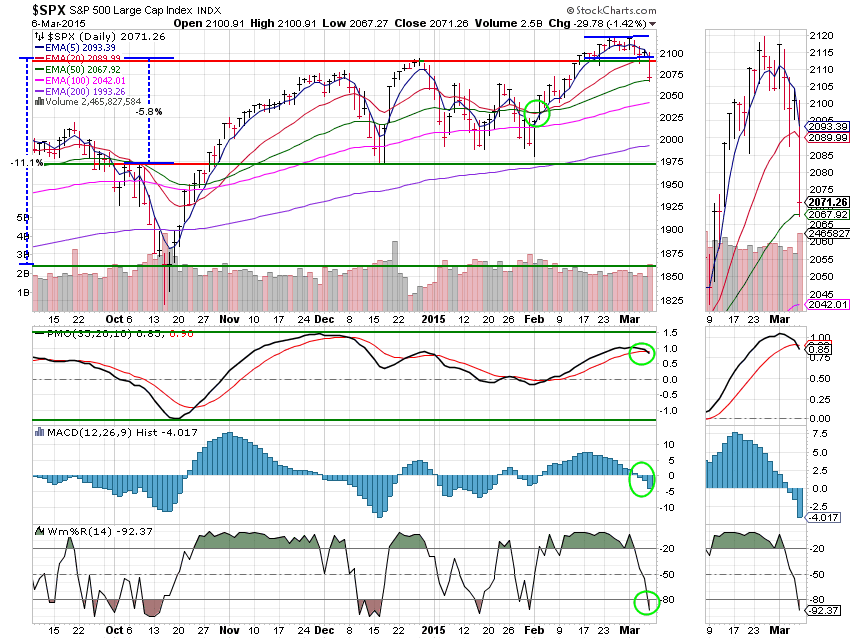
C Fund: Price broke support at 1990 so the next downside target (which I neglected to mark) is around 1990 and after that 1973. This chart is now on a neutral signal as three of our four indicators (PMO, MAC D, Wms%R) are in negative configurations. There’s no panic just yet though, as the 20 EMA is still has a great deal of separation from the 50 EMA. It will take a lot of additional negative pricing action before the 20 EMA will drop through the 50 EMA and trigger an overall sell signal. As they say, a lot can happen between now and then.