
Good Evening, In recent years (actually since 2009) it became an accepted fact that market would move straight up with few if any pullbacks. As we have discussed many times before, this behavior was fueled by the FOMC intervention commonly referred to as quantitative easing. All along I said that when the bond buying ended so would all the one sided action. With that in mind, was anybody surprised by today’s action? It is a normal function for an up trending market to selloff periodicaly and take a rest before resuming it’s march higher. It is not only healthy but desirable as it provides an opportunity for investors to buy in for the run up. It is those investors moving into stocks that fuel the market higher. In the case of the aforementioned quantitative easing it was the Fed money that drove the market higher. Of course every downtrend starts with a selloff and visa versa, but I don’t think that’s the case today. More than likely barring any unusual stimuli the market will sell off for one to three days and then move higher. That’s what I think we have here. Of course we got on board with another 35% this morning. Be patient! One day does not make a trend…..
The days selling left us with the following results: Our TSP allotment stepped back -0.672%. For comparison, the Dow lost -0.64%, the Nasdaq -1.26%, and the S&P 500 -1.12%.
Stocks March to Oil’s Drum Again in Losing Session
The days action left us with the following signals: C-Neutral, S-Neutral, I-Neutral, F-Neutral. We are now invested at 40/G, 60/C. Our allotment is now +1.06% on the year not including the day’s results. Here are the latest posted results:
| 03/07/16 | |||||
| Fund | G Fund | F Fund | C Fund | S Fund | I Fund |
| Price | 14.971 | 17.2608 | 27.1166 | 34.1277 | 23.0425 |
| $ Change | 0.0022 | -0.0022 | 0.0261 | 0.2540 | -0.0855 |
| % Change day | +0.01% | -0.01% | +0.10% | +0.75% | -0.37% |
| % Change week | +0.01% | -0.01% | +0.10% | +0.75% | -0.37% |
| % Change month | +0.03% | -0.37% | +3.64% | +5.58% | +4.26% |
| % Change year | +0.37% | +1.80% | -1.62% | -3.14% | -4.37% |
| L INC | L 2020 | L 2030 | L 2040 | L 2050 | |
| Price | 17.7571 | 22.9943 | 24.7023 | 26.0992 | 14.7042 |
| $ Change | 0.0034 | 0.0071 | 0.0101 | 0.0131 | 0.0089 |
| % Change day | +0.02% | +0.03% | +0.04% | +0.05% | +0.06% |
| % Change week | +0.02% | +0.03% | +0.04% | +0.05% | +0.06% |
| % Change month | +0.82% | +1.92% | +2.63% | +3.07% | +3.51% |
| % Change year | -0.09% | -0.92% | -1.44% | -1.78% | -2.14% |
Now lets take a look at the charts. If you click on the charts they will become larger. All signals are annotated with Green Circles.
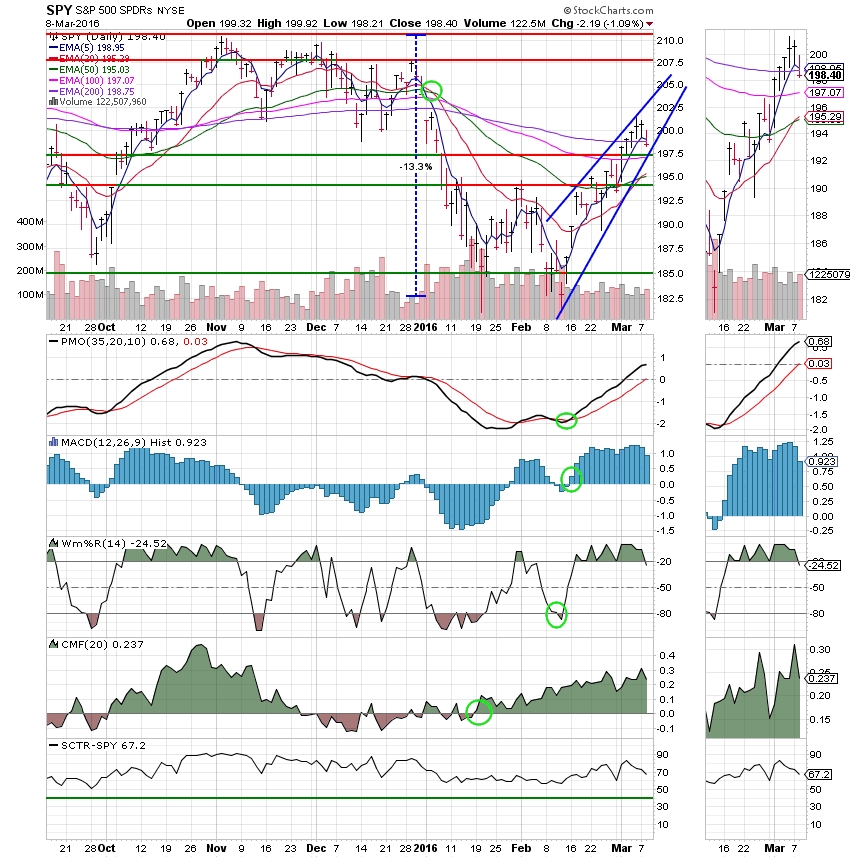
C Fund: Price is still within the ascending wedge and the next resistance is not until 207.5. I think we’re going high but I’ve been wrong before….. Why do I think we’re heading up? Take a look at the Chaikin Money Flow Indicator (CMF). There’s plenty of money here to send us higher! That’s not just in the C Fund either. Take a look at the S and I Funds.
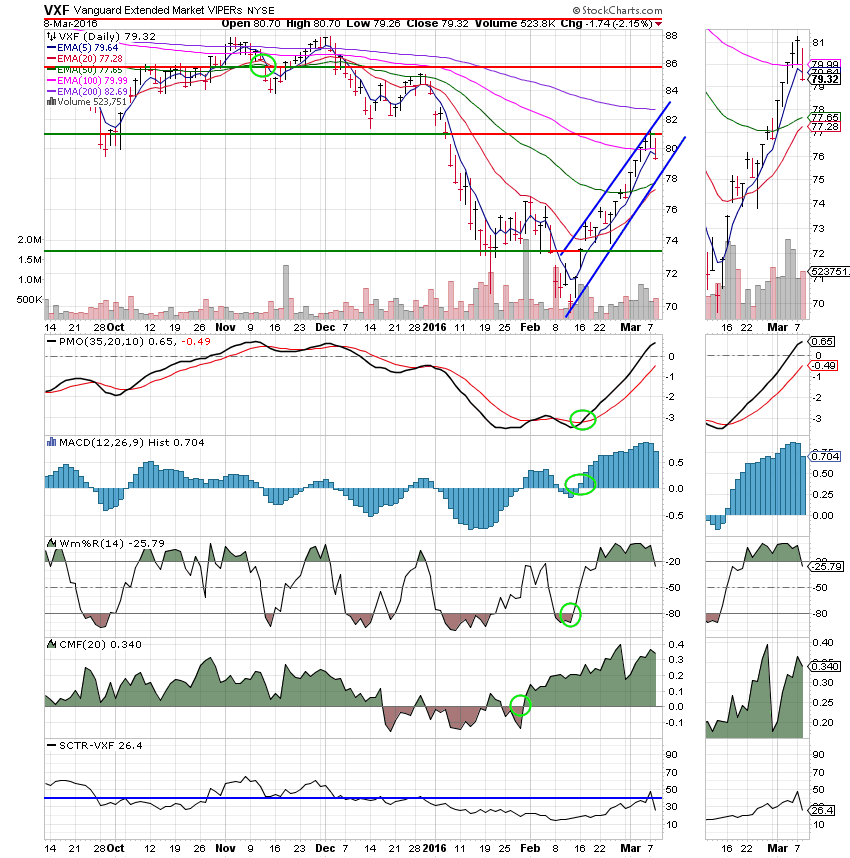
S Fund: Small caps were hammered today and there are enough of them in the S Fund that it showed. The thing about the S Fund is that when the market goes up it goes up fast, but then the market goes down it does down faster. If you are expected any downside, this is not the place to be. An SCTR of 26.4 tells us all we need to know that…
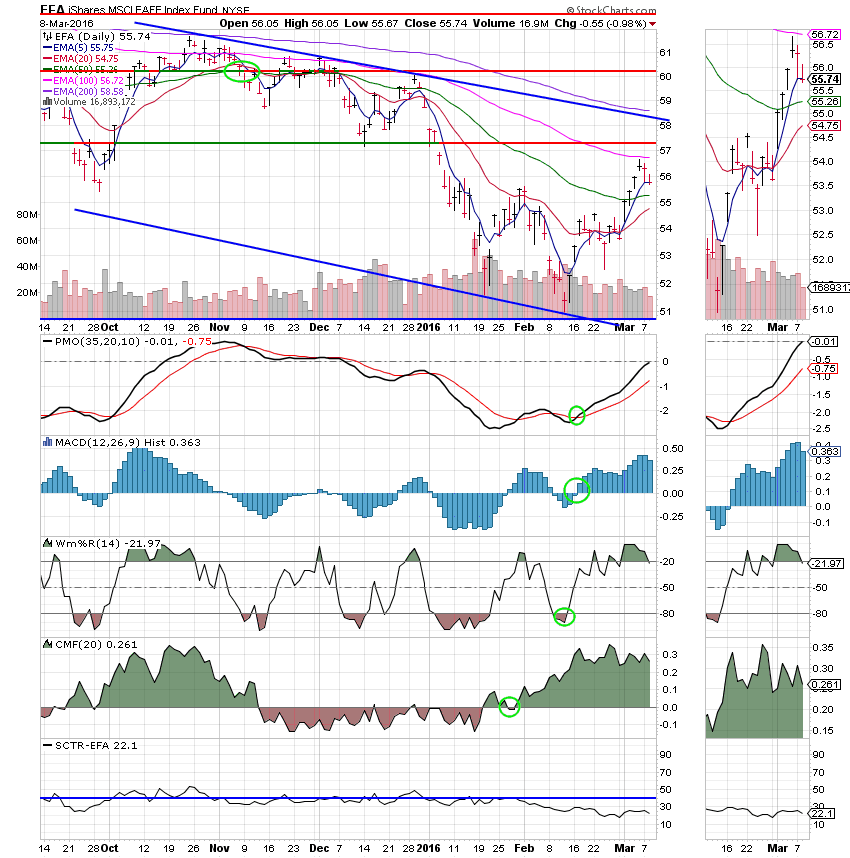
I Fund: Ditto the C And S Funds…..
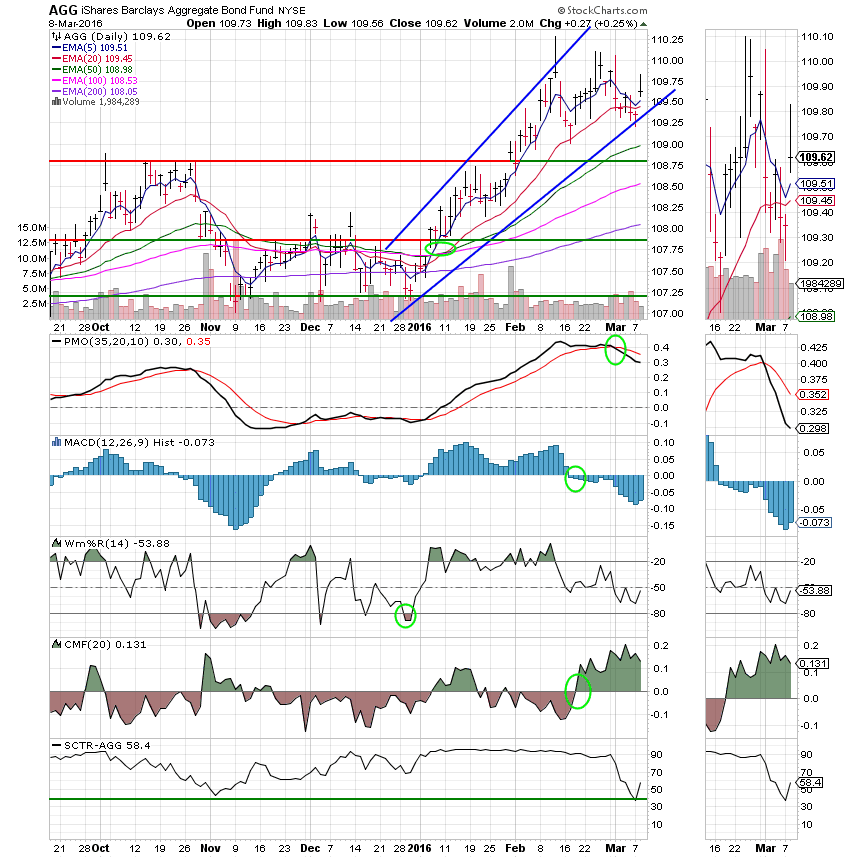
F Fund: Of course bonds worked on a day like today! An SCTR of 58.4 tells us that it hasn’t been working that way every day…..
That’s all for tonight. Have a great evening and I’ll see you tomorrow!
God bless, Scott ![]()