Good Evening.
The market sold off again today and suffered some technical damage in the process. Is this the big correction that the bears have been calling for 5 years? Enough with the speculation! It is a total waste of energy. When the charts tell me that it is the ‘big one’ I will sell. If they tell me the market may be making a turn but has not made it yet (neutral) I will hold. If they tell me it has turned around and the coast is clear, then I will buy. If you think about all the things that could take place, it will drive you crazy and you will have not rest. You will spend all of your time worrying and God’s word tells us that will profit us nothing. If we let worry distract us from the things that are really important, we will spend our time in distraction instead of in service to Him. Yes, the market sold off. It has done so before and it will do so again and you know what? We have always survived and in the end our portfolios have grown…. Give God who guides us all the praise for He and He alone is worthy!
The day’s sell off left us with the following results: Our TSP allotment lost -1.712% and AMP dropped -1.367%. For comparison, the Dow lost -1.85%, the Nasdaq -1.67%, the S&P -1.70%, AT&T 1.71%, Alaska Air +0.30%, Facebook -2.38% AND Apple -2.07%
As the news below will tell you, today’s excuse was a possible interest rate increase. We will see if there is any relief when the March FED minutes are released ……
The day’s action left us with the following signals: C-Neutral, S-Neutral, I-Neutral, F-Neutral. We are currently invested at 30/C, 34/S, 36/I. Our allocation is now +1.25% for the year but that does not include today’s results.
Here are the latest posted results:
| 03/09/15 |
|
|
|
|
| Fund |
G Fund |
F Fund |
C Fund |
S Fund |
I Fund |
| Price |
14.6679 |
16.8657 |
27.5505 |
37.5072 |
25.3542 |
| $ Change |
0.0023 |
0.0337 |
0.1107 |
0.1227 |
-0.1381 |
| % Change day |
+0.02% |
+0.20% |
+0.40% |
+0.33% |
-0.54% |
| % Change week |
+0.02% |
+0.20% |
+0.40% |
+0.33% |
-0.54% |
| % Change month |
+0.05% |
-0.81% |
-1.14% |
-0.73% |
-2.38% |
| % Change year |
+0.35% |
+0.38% |
+1.42% |
+3.34% |
+4.69% |
| |
L INC |
L 2020 |
L 2030 |
L 2040 |
L 2050 |
| Price |
17.5919 |
23.2609 |
25.2882 |
26.9567 |
15.3265 |
| $ Change |
0.0096 |
0.0167 |
0.0227 |
0.0284 |
0.0157 |
| % Change day |
+0.05% |
+0.07% |
+0.09% |
+0.11% |
+0.10% |
| % Change week |
+0.05% |
+0.07% |
+0.09% |
+0.11% |
+0.10% |
| % Change month |
-0.29% |
-0.76% |
-0.97% |
-1.10% |
-1.24% |
| % Change year |
+0.81% |
+1.58% |
+1.94% |
+2.19% |
+2.46% |
Now let’s get to the serious stuff:
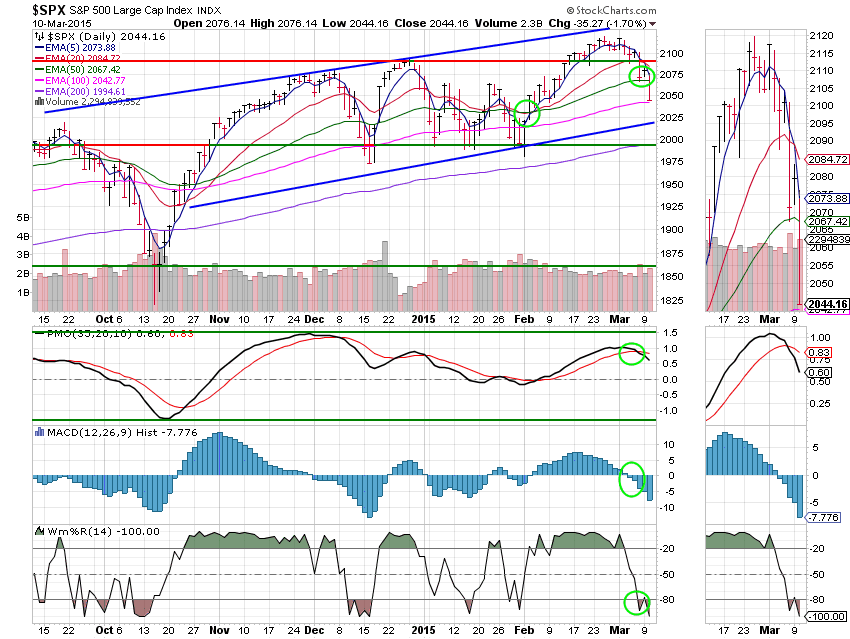
C Fund: I know this is going to be a hard thing to choke down, but the trend is still up. I have drawn the long term trend line to illustrate this point. As you can see, it will take some more negative action to break that trend. That said, things at the moment are definitely getting weaker. The 20 EMA has now turned down toward the 50 EMA. Should price continue to trade below the 50 EMA it could drag the 20 EMA down through the 50 which would generate a sell signal. The PMO, MAC D and Williams %R all remain negative. This chart has definitely suffered some technical damage as it continues to weaken.
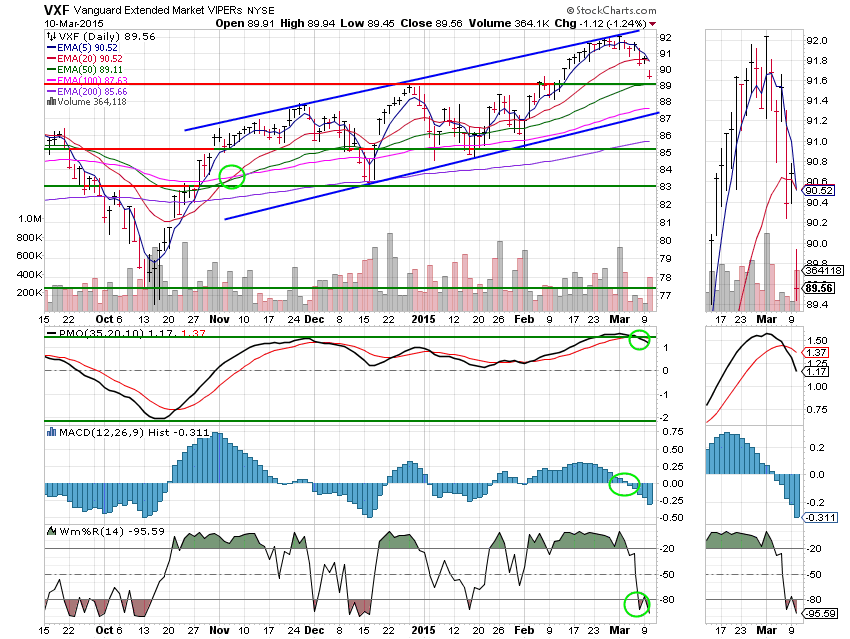
S Fund: The S fund remains stronger than the C Fund mainly due to the fact that its 20 EMA has managed to maintain a good deal of separation form its 50 EMA. The S Fund, believe it or not, also remains in a upward trend as denoted be the ascending channel lines annotated in blue. The two things I will look for on this and the C Fund chart are the 20 EMA passing through the 50 EMA and price trading below the lower ascending trend line. If those things happen I will become very concerned as it may mark the end of this upward trend. This chart also remains on a Neutral signal with only price in a positive configuration.
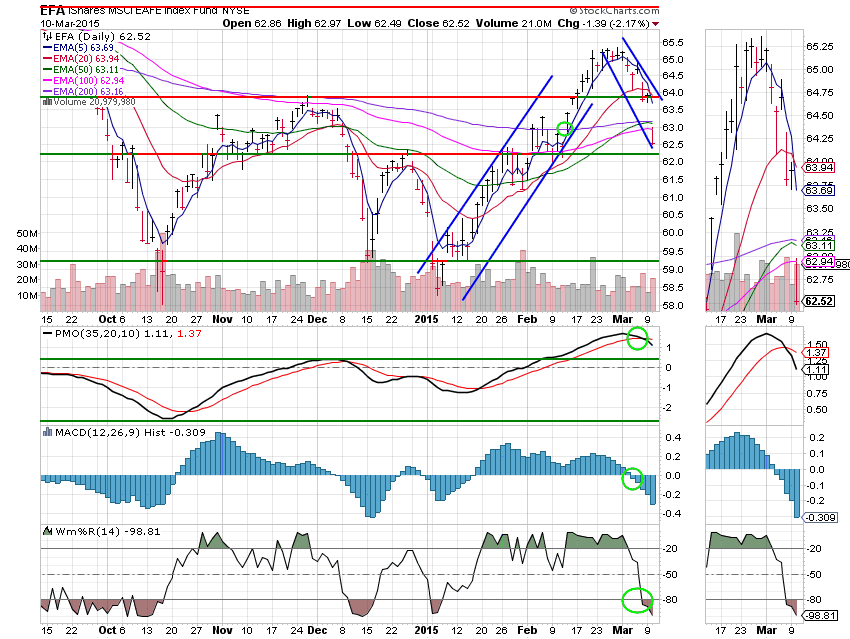
I Fund: The I Fund is a different sort of animal from the C and the S. It has clearly broken its upward trend. Of note is the fact that the 20 EMA has turned down. If price continues to stay under the 50 EMA it could endanger this chart’s neutral signal. Other than price, all indicators are on a sell signal and continue to weaken. As on the charts of the C And S funds, we will be paying particular attention to the 20 EMA to see if it makes a negative crossover of the 50 EMA. That would generate a sell signal using our current set of indicators, barring any help from the shorter term indicators which can reverse quickly. In particular, I will be watching the Williams % R for such a reversal.
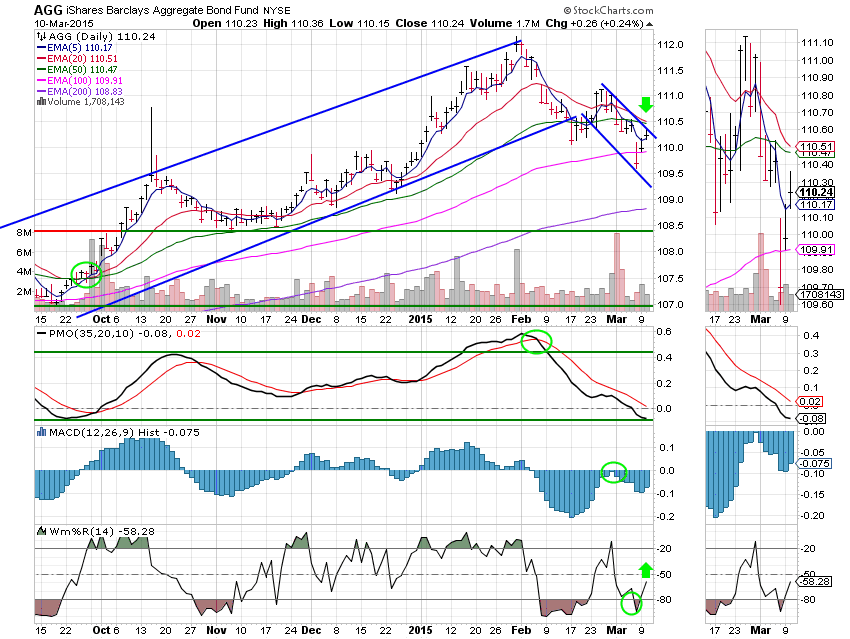
F Fund: The F Fund is the closest of our Funds to having a negative crossover of the 50 EMA by the 20 EMA annotated by the first green arrow. However, if that were to occur today, this chart would still remain on a neutral signal as the Williams %R (our most sensitive indicator) has turned up, annotated by the second green arrow. This fund, which is TSP’s play on bonds, managed a couple of positive days, but be wary of this action. The same concern that sunk that market today would do even more damage to bonds. An interest rate increase will do great damage to bonds when it actually comes. So with that in mind, I would prefer cash to the F Fund at this time, or in TSP– the G Fund. Also of note concerning a probable rate increase is that it would benefit the G fund in that it would pay a greater return. I can remember when I first started my Thrift account that many folks would just leave their money in the G Fund, which was paying around six percent a year. Of course, due to the current low bond yields the G Fund is little better than cash now. For those of you that are new to the game, bond yields and bond prices always move in opposite directions so the current high bond prices have forced the yields lower.
Somebody asked how low this dip will go? Not to be sarcastic; I told them it will go down until it turns back up. Nobody knows how long a downturn will last. That’s the reason that there was so much under-performance last year- including our allocation. The many v-shaped bounces have beaten fund managers into submission and they are all (myself included) using an increased time frame before they exit the market. Yes we have indicators that warn us of a possible down trend and yes technicians can use things such as former resistance to estimate a target for the downside. While these things are helpful, they do not tell us where the exact bottom will be. We must just remain disciplined and sell only when we have reached the burn limit set by our indicators, so keep watching your charts. We are now at a crossroad! That’s all for tonight. Have a great evening and may God continue to bless your trades.
God bless,
Scott
