
Good Evening, Yesterday Mario Draghi and the ECB increased their version of quantitative easing and today oil resumed it’s march (no pun intended) higher. As a result the market also moved higher with the S&P putting in a 2016 high.
The days rally left us with the following results: Our TSP allotment gained another +0.984%. For comparison, the Dow gained +1.28%, the Nasdaq +1.85%, and the S&P 500 +1.64%.
ECB stimulus, firmer oil push S&P 500 to 2016 high
The weeks action left us with the following signals: C-Neutral, S-Neutral, I-Neutral, F-Neutral. Our TSP allotment is +0.73% not including the days gains. Here are the latest posted results:
| 03/10/16 | Prior Prices | ||||
| Fund | G Fund | F Fund | C Fund | S Fund | I Fund |
| Price | 14.9731 | 17.2647 | 26.9632 | 33.3623 | 22.9039 |
| $ Change | 0.0007 | -0.0127 | 0.0058 | -0.1919 | -0.0337 |
| % Change day | +0.00% | -0.07% | +0.02% | -0.57% | -0.15% |
| % Change week | +0.03% | +0.01% | -0.47% | -1.51% | -0.97% |
| % Change month | +0.05% | -0.35% | +3.05% | +3.21% | +3.64% |
| % Change year | +0.39% | +1.83% | -2.17% | -5.32% | -4.94% |
| L INC | L 2020 | L 2030 | L 2040 | L 2050 | |
| Price | 17.7303 | 22.9068 | 24.5701 | 25.9335 | 14.5961 |
| $ Change | -0.0042 | -0.0129 | -0.0199 | -0.0254 | -0.0167 |
| % Change day | -0.02% | -0.06% | -0.08% | -0.10% | -0.11% |
| % Change week | -0.13% | -0.35% | -0.49% | -0.58% | -0.68% |
| % Change month | +0.66% | +1.53% | +2.08% | +2.42% | +2.75% |
| % Change year | -0.24% | -1.30% | -1.97% | -2.40% | -2.86% |
Now lets take a look at the charts. If you click on the charts they will become larger. All signals are annotated with Green Circles.
C Fund: Price continues to move up the bullish ascending wedge. All indicators are getting stronger. Price has clear sailing until it reaches resistance at 207.60.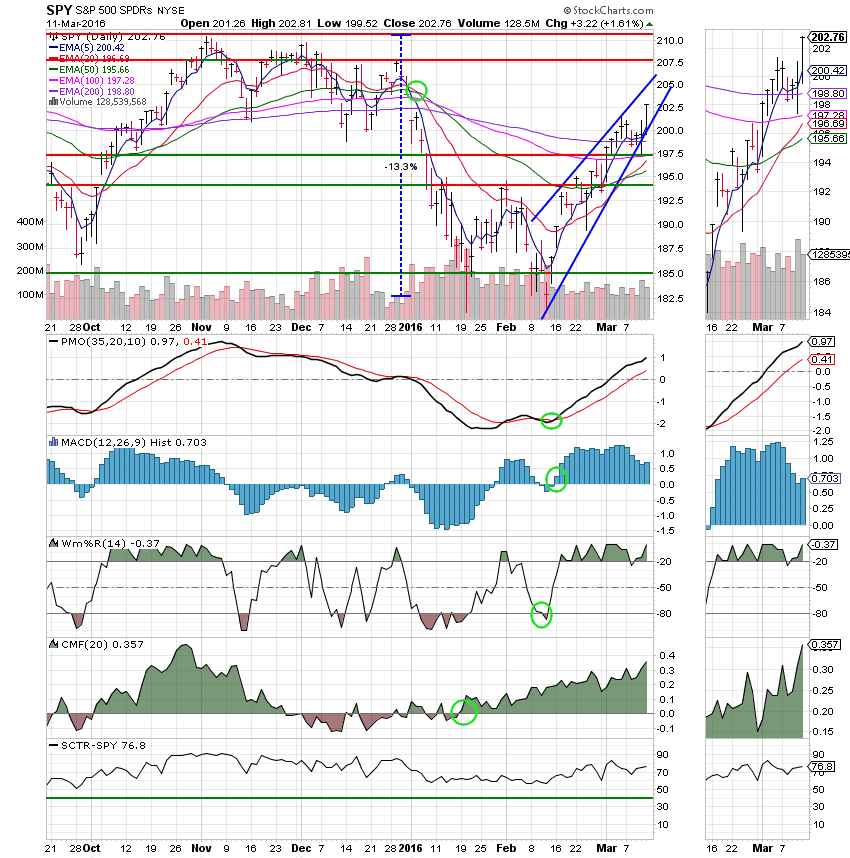
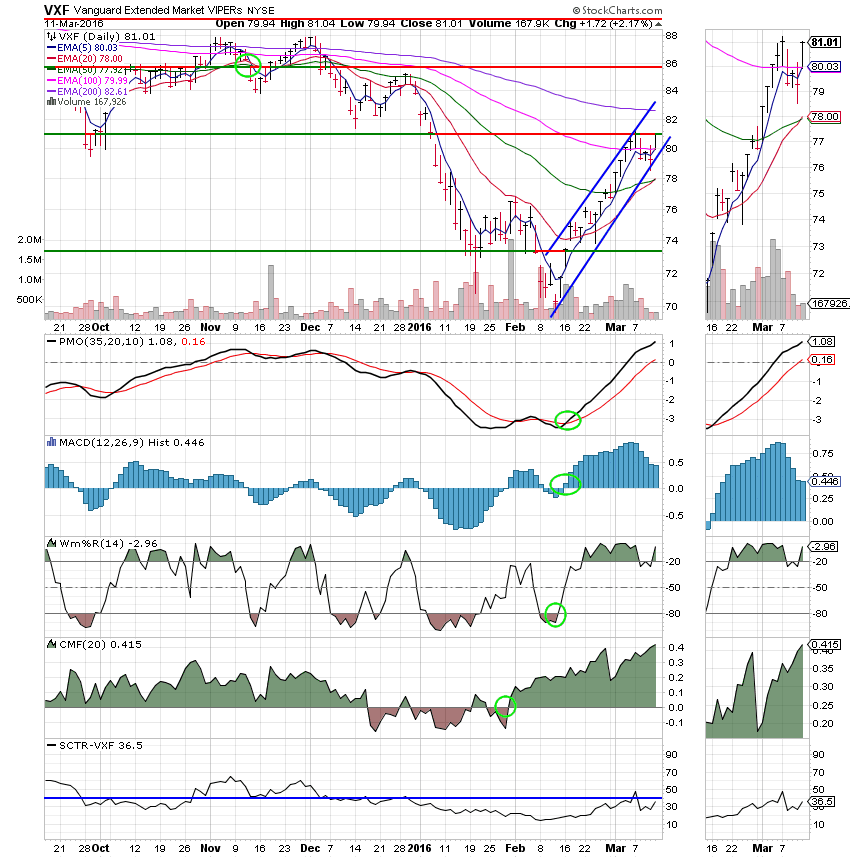
S Fund: Like I said a few days ago. Small caps go up fast and down even faster. You have to know for sure which direction the market is heading before you use the S Fund as it is a midcap blend that has a lot of small caps. Today that direction was up. This fund is showing a lot of strength which bodes well for stocks. All indicators are improving and most importantly the SCTR is rising. Price moved it’s 20 EMA up through it’s 50 EMA. If this fund continues to improve we’ll be able to put some money to work here soon.
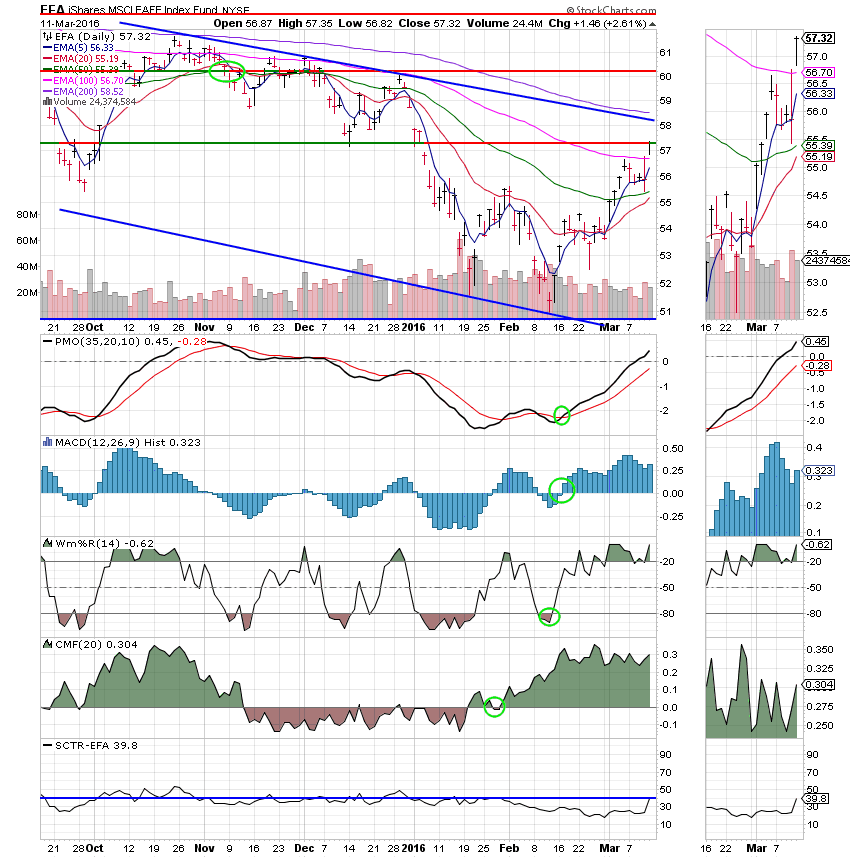
I Fund: This one’s just a little behind, but it’s chart has the same developments as the S Fund. It had the highest return of any of our equity based funds on the day.
F Fund: Price dipped below it’s lower trend line today but that’s not the big news. The SCTR is in a rapid decent and shows that this fund is deteriorating as compared to other investments.

Our task now is to carefully watch our charts for the next opportunity to increase our allotment in equities. So far so good, but remember, it is best not to get in too big of a hurry. As long as the 50 EMA remains under the 200 EMA on our charts, the risk is much higher that things could head back down so it’s steady as she goes and just be happy that your making money again. Also remember, it’s not what you make but what you keep that’s important. Have a great weekend!
God bless, Scott ![]()