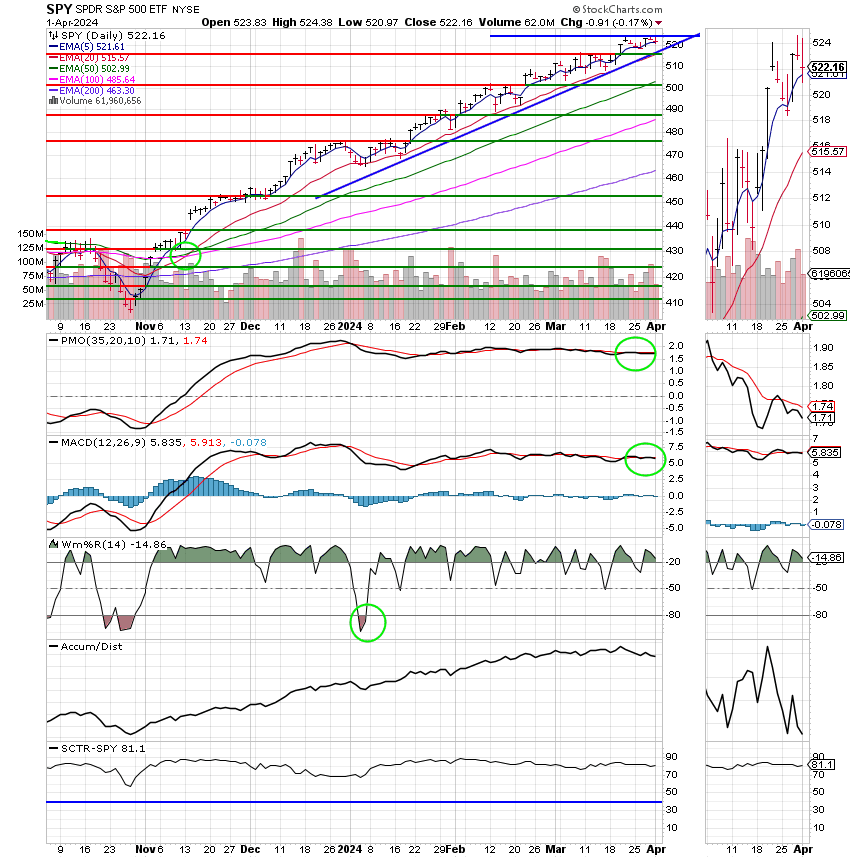
Good Evening, There’s another month on the books. Overall, it’s been another successful month with the Dow Industrial Average rising 2.1% in March for its fifth straight winning month. The first time since August 2020 that it has put five months of gains together. It posted a nice gain of 5.6% in the first quarter. The S&P 500 added 3,1% in march and managed a whopping gain of 10.2% for the quarter. That was the best for the index since 2019. The Nasdaq added 1.8% in March but rallied 9.1% for the quarter. The tech heavy index experienced headwinds from persistently high treasury rates. Given the good quarter, the market feels very overbought and due for a pullback. Honestly, I’m not sure I remember a pre stimulus market going this long without a meaningful pullback. It is my thought that such a correction could occur if the Fed fails to start cutting rates in June as the market expects. It has been my contention all along that the Fed will not be able to start cutting rates in June. I’ll bet that the first cut doesn’t come until July at the earliest. Think about it. The economy is still very strong and inflation remains persistently above the Fed’s target of two percent. What incentive do they have to get in a hurry to cut rates? Why should the risk reigniting inflation when they don’t have to? As long as economic growth and the rate of employment remain acceptable what incentive do they have to be in a hurry to raise rates? That is the reason that I will not be surprised if they delay cutting rates for another month. At this point they simply don’t have a reason to cut. We’ll see what happens, but understand that we will rely on our charts to tell us when and where to move. The purpose of this discussion is only to anticipate what we might see on our charts. The market is extended and looking for a pullback and this scenario would be the perfect excuse for one to occur. As I started saying over two years ago expect more volatility until the rate of inflation drops to two percent.
For now we will remain invested at 100/C. The chart for the C Fund remains the best among our TSP funds if even by just a little. One thing worth noting is that the stronger charts may not always gain the most on a strong day for the market but they will almost always keep the most when it sells off.
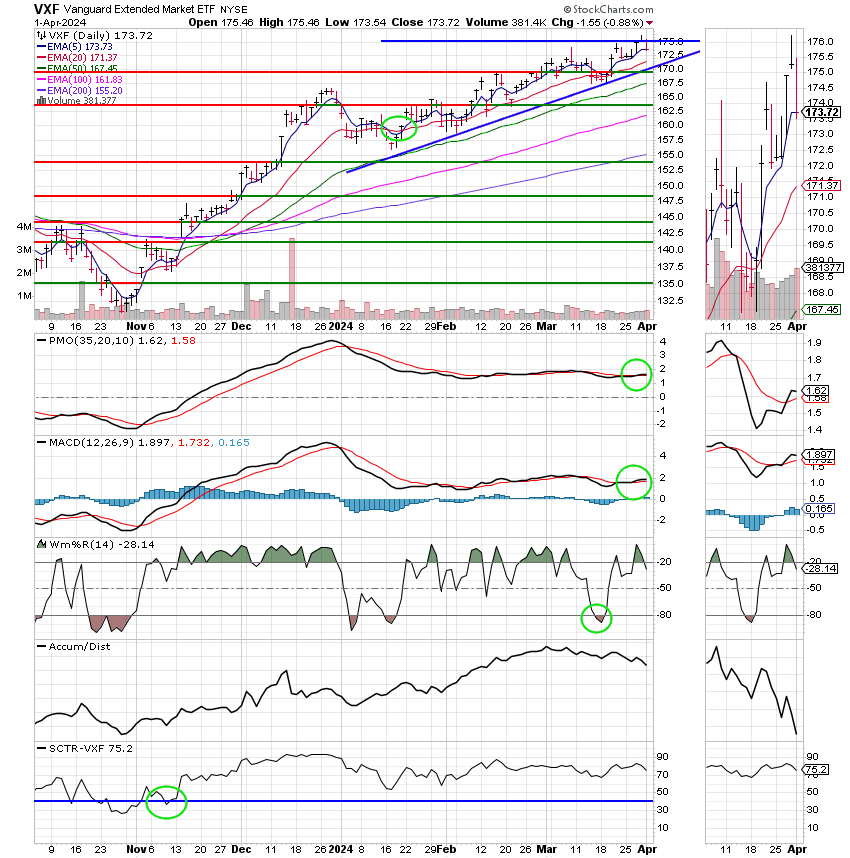
The days trading left us with the following results. Our TSP allotment slipped back -0.17%. For comparison, the Dow fell -0.61%, the Nasdaq managed a slight gain of +0.11%, and the S&P 500 dropped -0.17%. Todays results for the S fund are a good example of what I was talking about above with regard to charts. It fell -0.88% which was considerably more than the C fund which fell only -0.17%. It was a good day to be in the C fund.
Dow closes more than 200 points lower to begin April as Treasury yields pop: Live updates
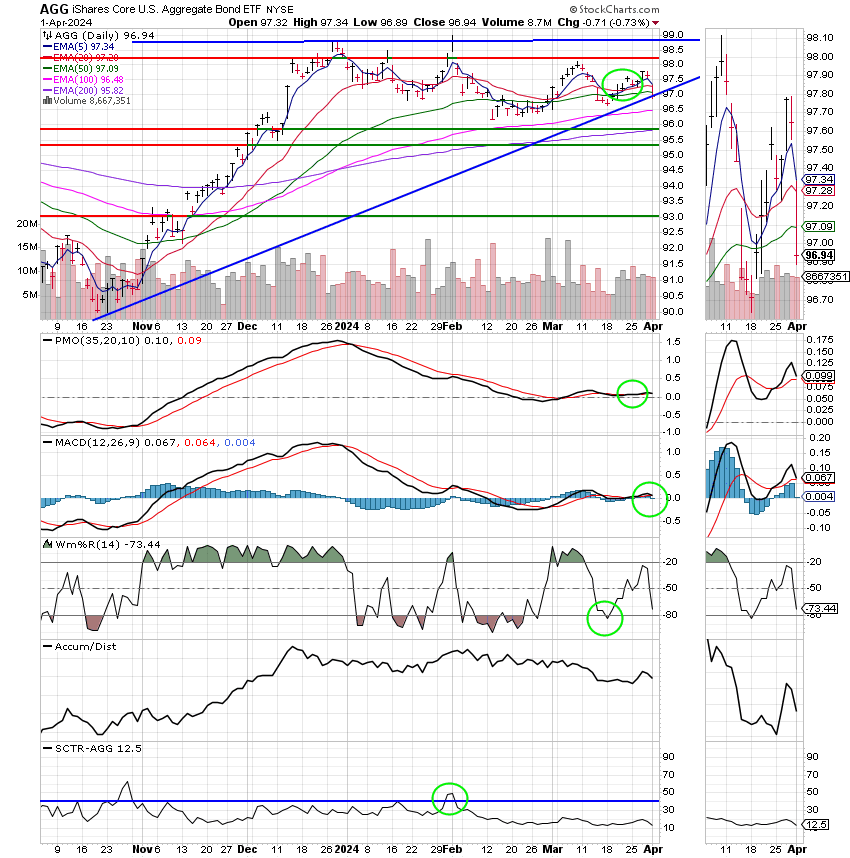
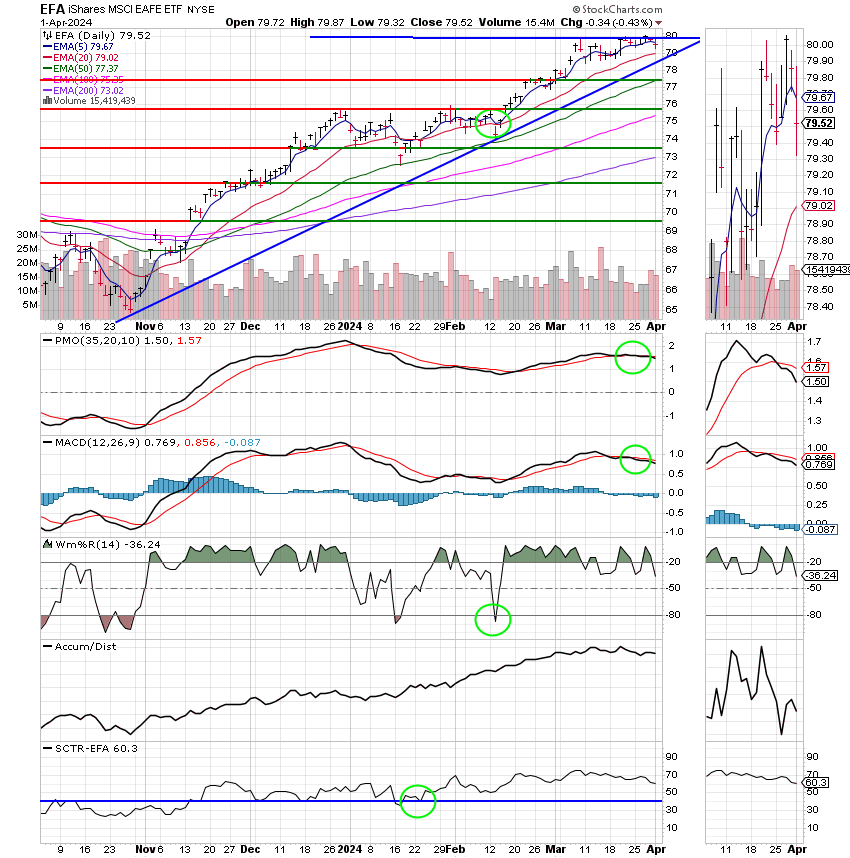
The days action left us with the following signals: C-buy, S-Buy, I-Buy, F-Sell. We are currently invested at 100/C. Our allocation is now +4.84% on the year not including the days results. Here are the latest posted results:
| 03/28/24 | Prior Prices | ||||
| Fund | G Fund | F Fund | C Fund | S Fund | I Fund |
| Price | 18.152 | 19.08 | 82.2085 | 82.4312 | 42.574 |
| $ Change | 0.0089 | -0.0119 | 0.0943 | 0.2432 | -0.1027 |
| % Change day | +0.05% | -0.06% | +0.11% | +0.30% | -0.24% |
| % Change week | +0.11% | +0.17% | +0.40% | +1.85% | +0.24% |
| % Change month | +0.38% | +0.87% | +3.22% | +3.33% | +3.36% |
| % Change year | +1.05% | -0.74% | +10.55% | +6.92% | +5.95% |


