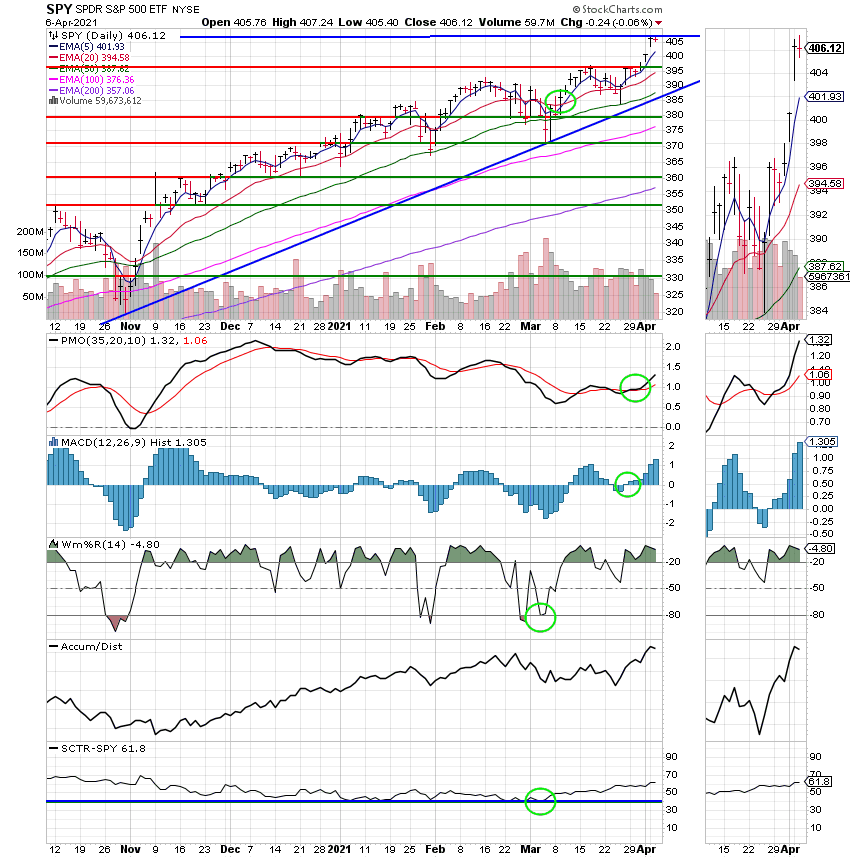
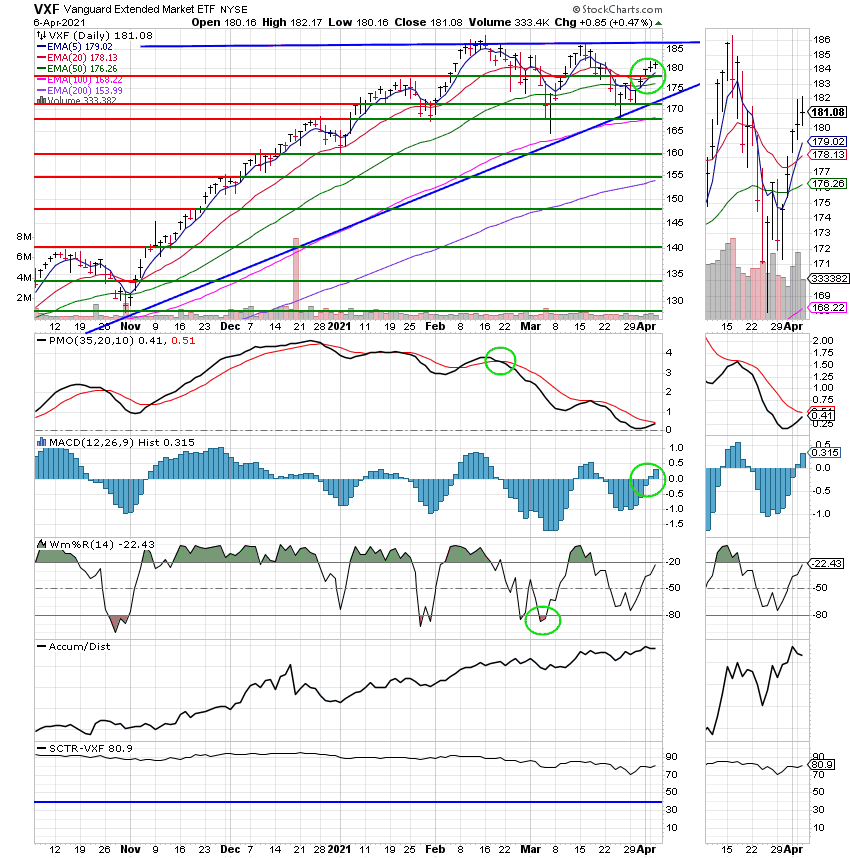
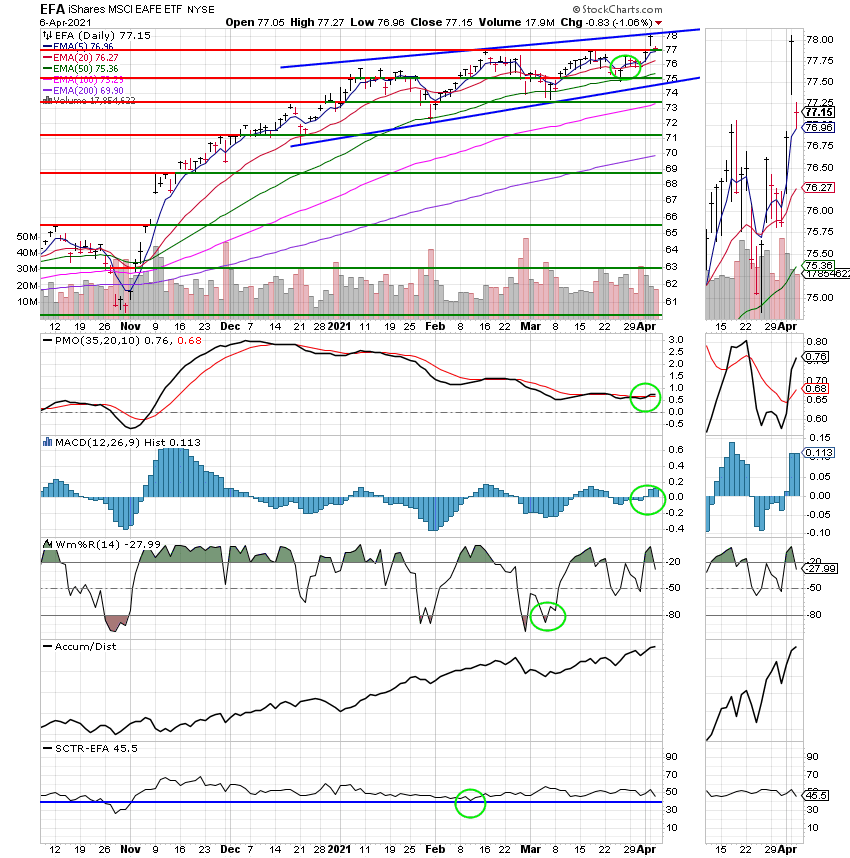
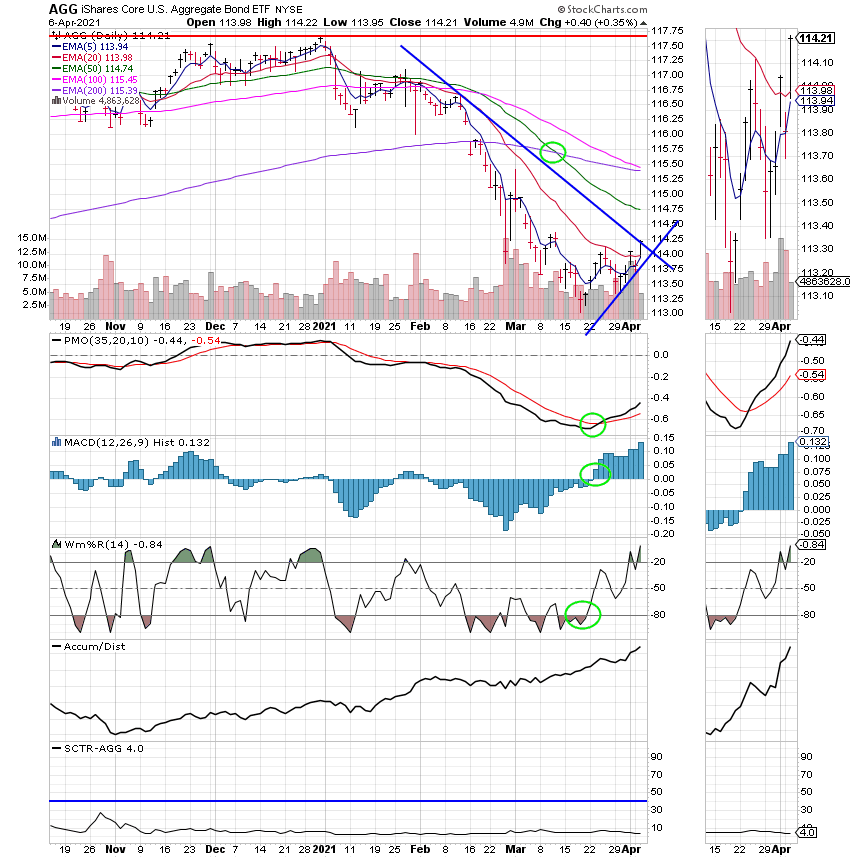
Good Evening, The market these days is clearly bifurcated with different leadership on different days. One day it will be stocks moving higher that are expected to be favored by the economic recovery such as consumer cyclicals. The next day those sectors will be down and the technology stocks that led last years comeback will be moving higher again. About every third or fourth business day both the tech and recovery plays will rally. The market seems confused and that leaves a lot of investors confused. As far as thrift goes the dynamic is played out between the S Fund and the C Fund. One or the other will have the upper hand on a particular day depending on whether or not the recovery stocks or tech stocks are rallying that day. The recovery days favor small caps which make up about half of the S fund with the other days favoring the large cap stocks found in the C Fund. If it is one of those days that comes every fourth day or so when both tech and recovery tocks are moving higher then guess what? Both the C Fund and S Fund have good days. What about the I Fund? It’s just hanging out there subject to the European and Asian markets which have been extremely inconsistent as of late. Another factor, which may eventually help the I Fund to perform better is the tightening of the dollar which will continue to happen as the US economy improves. That makes American goods more expensive which in turn makes foreign goods cheaper and that benefits the I Fund. So keep a close eye on the charts for the I Fund and the US Dollar which will let you know if you should seriously consider moving some money into the that fund. Right now that’s a no go, but things can always change. That’s the reason we check the charts!
The days trading left us with the following results: Our TSP allotment posted a gain of +0.47%. For comparison, The Dow dropped -0.29%, the Nasdaq -0.05%, and the S&P 500 -0.10%. Praise God for giving us another good day!
The days action left us with the following signals: C-Buy, S-Buy, I-Buy, F-Hold. We are currently invested at 100/S. Our allocation is now +10.04% not including the days results. Here are the latest posted results:
| 04/05/21 | Prior Prices | ||||
| Fund | G Fund | F Fund | C Fund | S Fund | I Fund |
| Price | 16.5562 | 20.5303 | 60.9382 | 81.6487 | 37.4032 |
| $ Change | 0.0030 | -0.0250 | 0.8751 | 0.2602 | 0.3855 |
| % Change day | +0.02% | -0.12% | +1.46% | +0.32% | +1.04% |
| % Change week | +0.02% | -0.12% | +1.46% | +0.32% | +1.04% |
| % Change month | +0.02% | +0.22% | +2.66% | +2.09% | +2.09% |
| % Change year | +0.29% | -3.14% | +8.99% | +10.04% | +5.69% |
| Fund | L INC | L 2025 | L 2030 | L 2035 | L 2040 |
| Price | 22.6833 | 11.5744 | 40.5934 | 12.1604 | 45.9049 |
| $ Change | 0.0619 | 0.0626 | 0.2805 | 0.0916 | 0.3739 |
| % Change day | +0.27% | +0.54% | +0.70% | +0.76% | +0.82% |
| % Change week | +0.27% | +0.54% | +0.70% | +0.76% | +0.82% |
| % Change month | +0.57% | +1.13% | +1.45% | +1.59% | +1.73% |
| % Change year | +1.82% | +3.72% | +4.68% | +5.11% | +5.56% |
| Fund | L 2045 | L 2050 | L 2055 | L 2060 | L 2065 |
| Price | 12.5505 | 27.4406 | 13.3982 | 13.3981 | 13.3979 |
| $ Change | 0.1085 | 0.2516 | 0.1492 | 0.1493 | 0.1493 |
| % Change day | +0.87% | +0.93% | +1.13% | +1.13% | +1.13% |
| % Change week | +0.87% | +0.93% | +1.13% | +1.13% | +1.13% |
| % Change month | +1.85% | +1.96% | +2.35% | +2.35% | +2.35% |
| % Change year | +5.93% | +6.33% | +7.95% | +7.94% | +7.94% |


