Good Evening, The overall dynamics of the market has not changed it’s still swinging from recovery stocks to tech and back on a daily to weekly basis. What’s good one day doesn’t work the next and visa versa. It has been very hard to make any substantial headway. The market feels more like it’s moving sideways than it does like it’s in the midst of a bull run. It’s true that the major indices are setting new records but the average investor hasn’t made much money since the beginning of February. Of course there is always a little drama to add into the mix. Todays news that the FDA was recommending that distribution of the Johnson & Johnson Covid 19 vaccine be halted is another example of that. Reopening trades came under pressure this morning after the U.S. Food and Drug Administration said it’s recommending a pause in the Johnson & Johnson Covid-19 vaccine after reported cases of blood clotting. There have been six reported cases of a rare and severe type of blood clot after receiving the J&J vaccine, the FDA said. The administration is calling for a pause in the vaccine until Centers for Disease Control and Prevention concludes its investigation into these cases. “Until that process is complete, we are recommending this pause,” the FDA said. “This is important to ensure that the health care provider community is aware of the potential for these adverse events and can plan due to the unique treatment required with this type of blood clot.” Acting FDA Commissioner Janet Woodcock said later Tuesday that she expects the pause to last “a matter of days.” More than 6.8 million doses of the single-dose vaccine have been administered in the U.S. There you have it. That wasn’t all either. Inflation picked up just a tick to pressure on stocks as well. The consumer price index, one of Wall Street’s most-popular inflation gauges, rose 0.6% in March and increased 2.6% from the same period a year ago. Economists polled by Dow Jones were projecting the headline index to rise by 0.5% month over month and 2.5% year over year. Core CPI, which excludes volatile food and energy costs, increased 0.3% monthly and 1.6% year over year. Also looking back a few days we had a report that surprised analysts showing more people drawing unemployment than had been expected. No wonder the market is a bit confused. As I mentioned last week that dynamic was even effecting TSP with the C Fund doing well one day and the S Fund doing well on the other. Up until recently the S Fund was leading the way as it is made up of smaller companies that benefit more from the economic recovery, but now it’s the S Fund one day and the C Fund the next making it hard for TSP investors to position their investments. A popular allotment recently has been 50% C and 50% S. However, we have remained committed to S Fund at 100/S because it’s chart is just a little better than that of the C Fund. As long as that remains the case we will not split our allocation. On the street I am invested with half tech and half recovery stocks and have been able to make some consistent albeit muted gains…. The moral of that story is that sometimes you have to take what the market gives you. It’s a lot like a basketball. I’m sure many of you watched the NCAA tournament last month. The teams that tried to force the action instead of waiting for the game to come to them took an early exit. You must be disciplined and patient. You will always lose if you try to force a trade! You can’t make more than the market is giving…….
The days trading left us with the following results: Our TSP allotment posted a gain of +0.54%. For comparison, the Dow dropped -0.20%, the Nasdaq added +0.20%, and the S&P 500 was up +0.33%. Praise God for another good day!
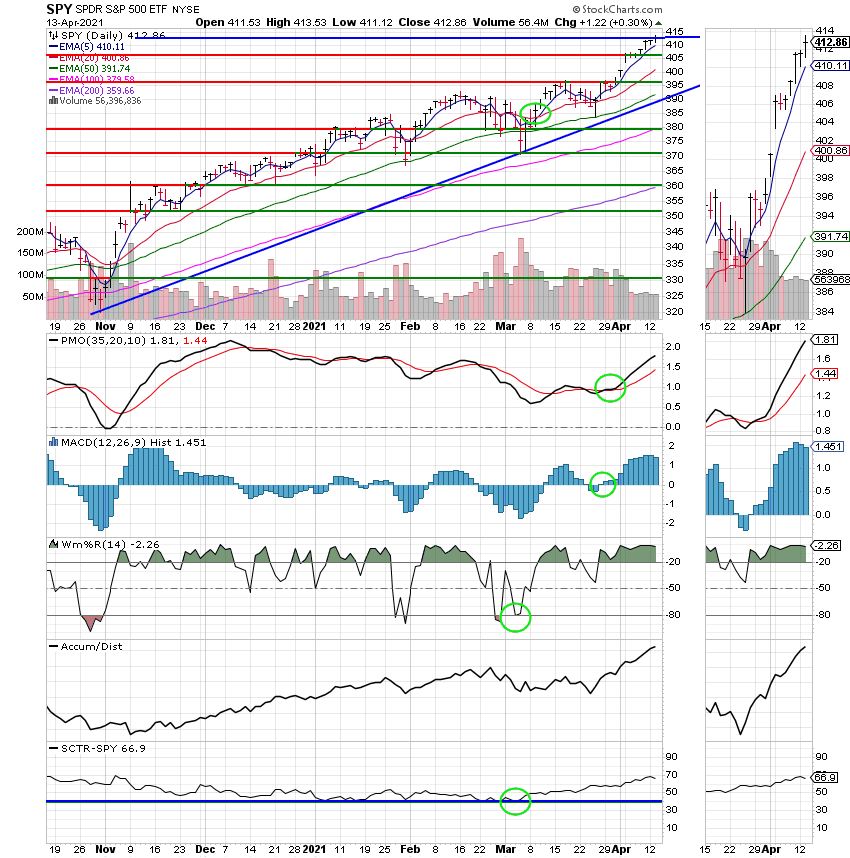
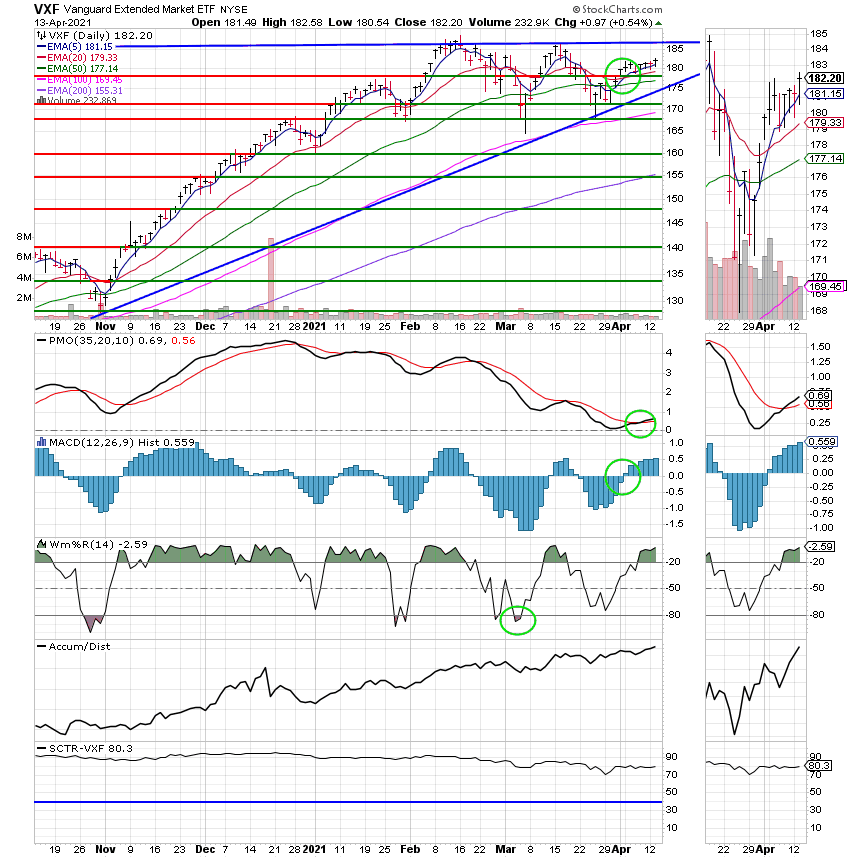
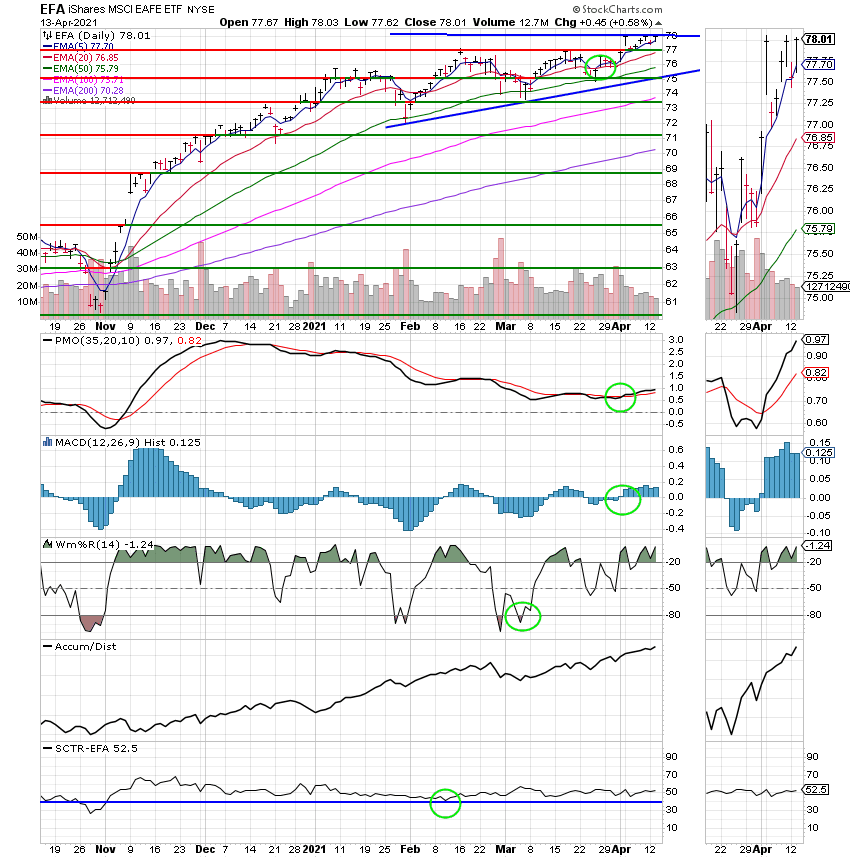
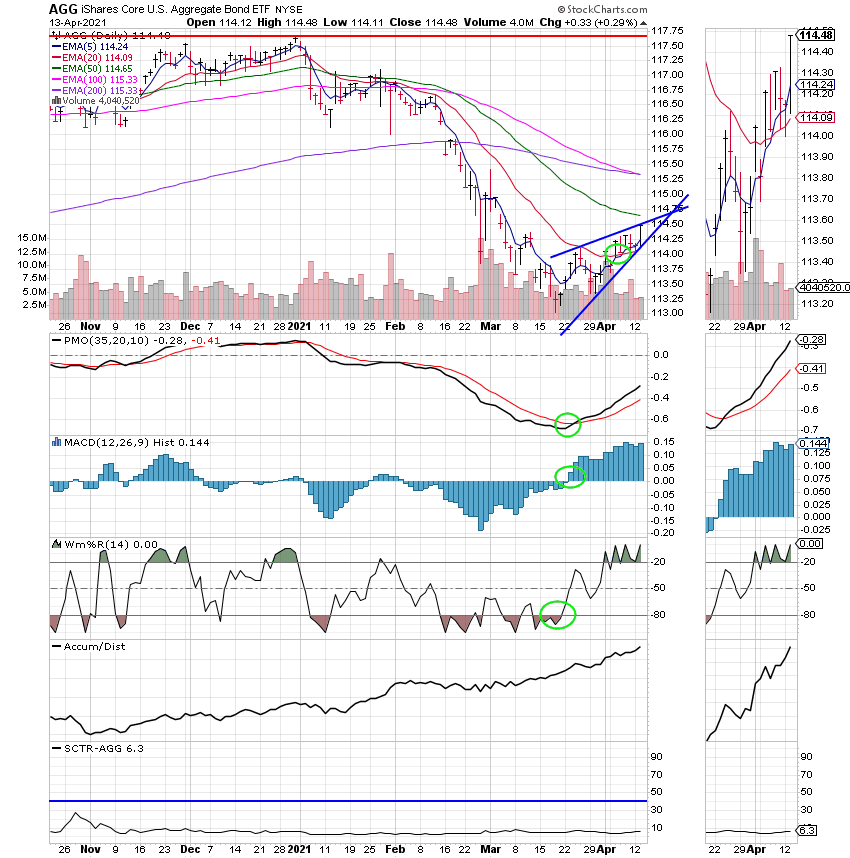
The days action left us with the following signals: C-Buy, S-Buy, I-Buy, F-Hold. We are currently invested at 100/S. Our allocation is now +11.20% for the year. Here are the latest posted results.
| 04/13/21 | Prior Prices | ||||
| Fund | G Fund | F Fund | C Fund | S Fund | I Fund |
| Price | 16.562 | 20.6339 | 61.9095 | 82.5086 | 37.5586 |
| $ Change | 0.0007 | 0.0502 | 0.2033 | 0.4168 | 0.1056 |
| % Change day | +0.00% | +0.24% | +0.33% | +0.51% | +0.28% |
| % Change week | +0.02% | +0.23% | +0.31% | +0.46% | -0.02% |
| % Change month | +0.06% | +0.72% | +4.29% | +3.16% | +2.52% |
| % Change year | +0.33% | -2.65% | +10.73% | +11.20% | +6.13% |
| Fund | L INC | L 2025 | L 2030 | L 2035 | L 2040 |
| Price | 22.7529 | 11.6396 | 40.8817 | 12.2546 | 46.2889 |
| $ Change | 0.0213 | 0.0202 | 0.0900 | 0.0296 | 0.1210 |
| % Change day | +0.09% | +0.17% | +0.22% | +0.24% | +0.26% |
| % Change week | +0.07% | +0.12% | +0.15% | +0.17% | +0.18% |
| % Change month | +0.88% | +1.70% | +2.18% | +2.38% | +2.58% |
| % Change year | +2.13% | +4.30% | +5.43% | +5.93% | +6.44% |
| Fund | L 2045 | L 2050 | L 2055 | L 2060 | L 2065 |
| Price | 12.6622 | 27.699 | 13.5442 | 13.5441 | 13.5439 |
| $ Change | 0.0355 | 0.0822 | 0.0456 | 0.0456 | 0.0456 |
| % Change day | +0.28% | +0.30% | +0.34% | +0.34% | +0.34% |
| % Change week | +0.19% | +0.20% | +0.22% | +0.22% | +0.22% |
| % Change month | +2.75% | +2.92% | +3.47% | +3.47% | +3.47% |
| % Change year | +6.87% | +7.33% | +9.12% | +9.12% | +9.12% |