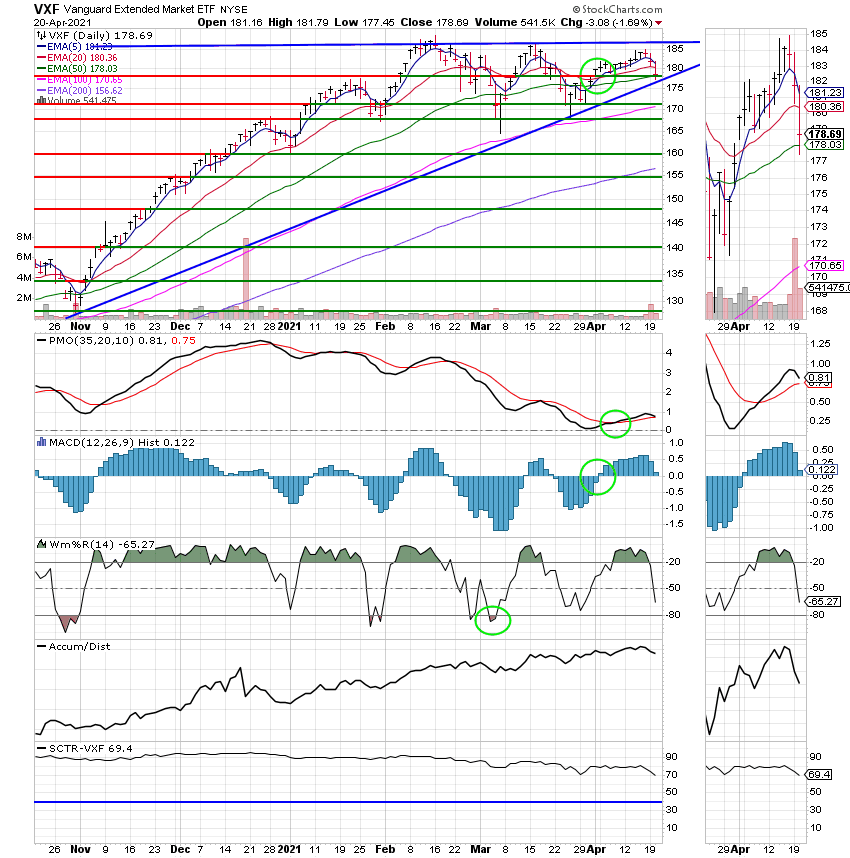
Good Evening, The market so far this year will try your patience. The major indices seem OK, but the action underneath is choppy. Most savvy investors move their money around to the stocks and funds in the hot sectors and are able to outperform the market as a whole by using this tactic. So far in 2021 that has not been the case. The sector rotation has been volatile moving from tech to value to safe havens such as real estate insurance trusts and utilities. This rotation could even be seen in thrift which is not usually the case. We talked about this rotation in the past few blogs about how it was evident in the relationship between the C and the S Funds. I have to give the nod to the C fund over the past few weeks but that could change quickly as this sector rotation continues. Also, as I mentioned previously it makes it very difficult to move with this action. Just as fast as you move to one fund or sector it loses favor. Up to now the charts have favored the S Fund but the C Fund is closing the gap. Will it overtake the S Fund and have the best chart in TSP? We will just have to monitor our charts to get the answer. For now we’re staying in the S Fund, but we’re giving it a short leash……. Don’t forget you can stay up to date with the latest market news on our Facebook page.
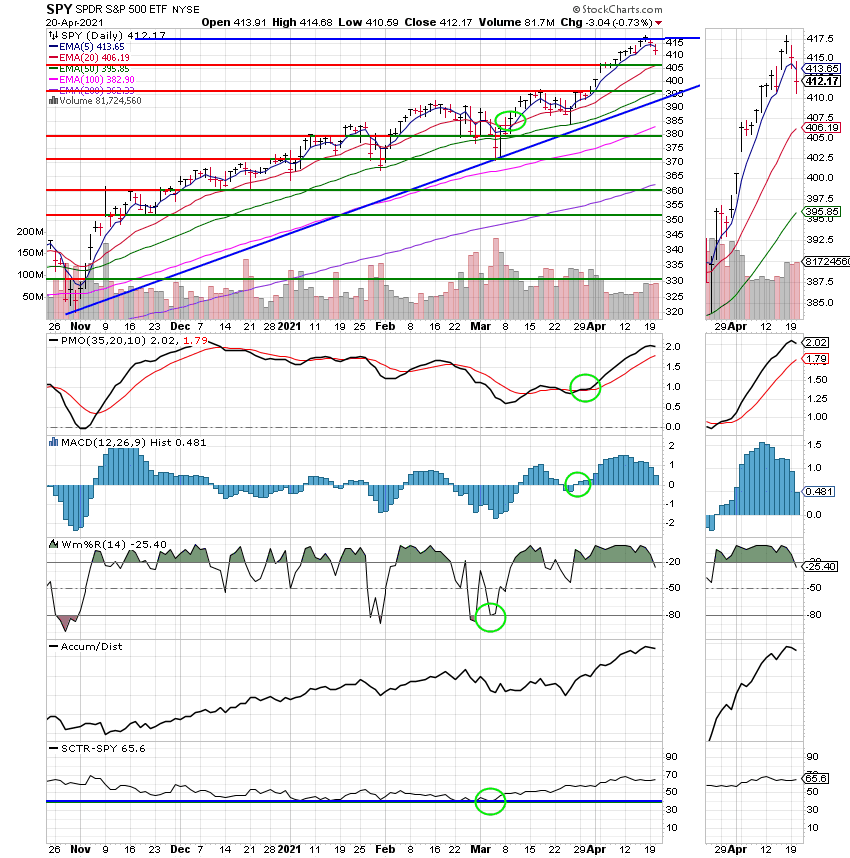
The days trading left us with the following results: Our TSP allocation gave up -1.69%. For comparison, the Dow closed -0.75% lower, the Nasdaq -0.92%, and the S&P 500 -0.68%. It was another day of red ink but I’m still praising God for what He does for our group!
Wall Street closes lower as virus spike hits travel stocks
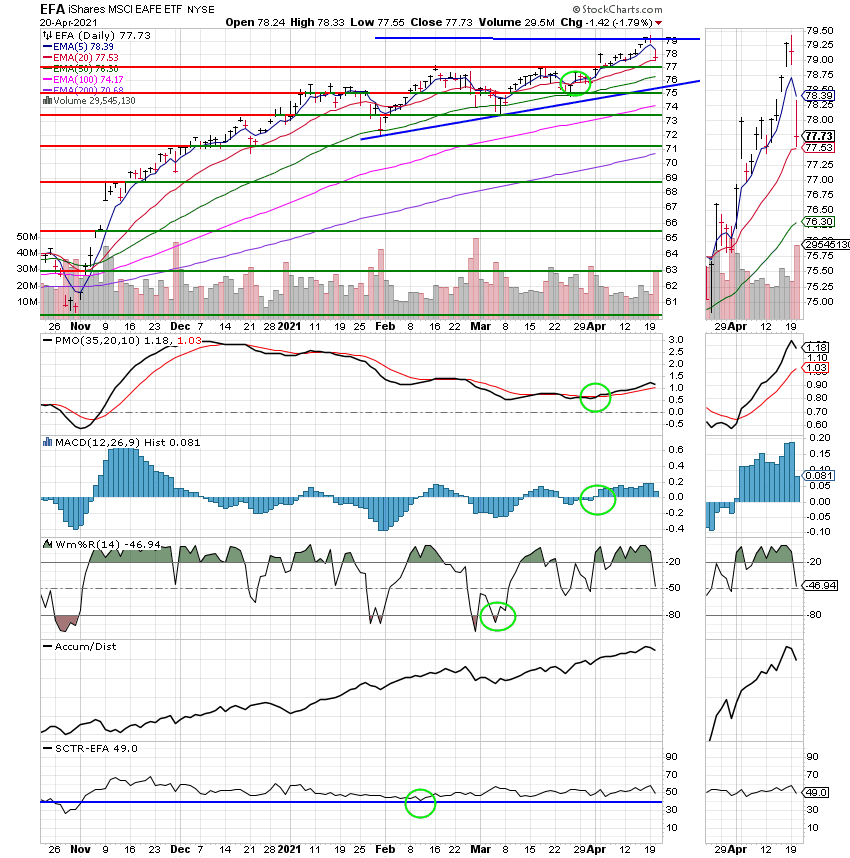
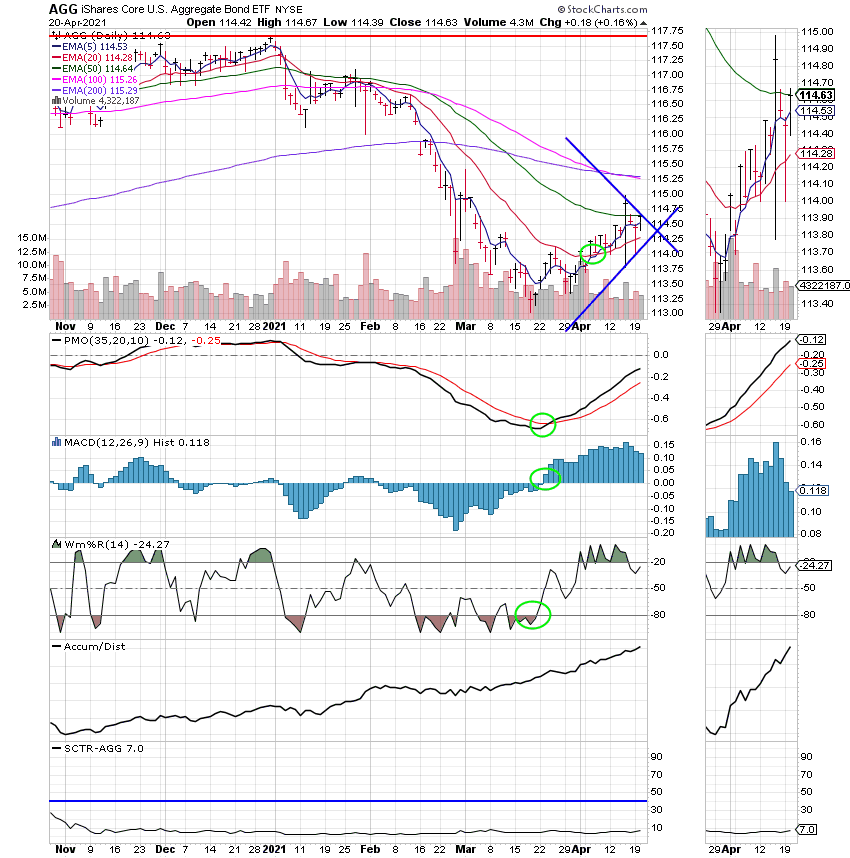
The days action left us with the following signals C-Buy, S-Buy, I-Buy, F-Hold. We are currently invested at 100/S. Our allocation is now +9.09% for the year. Here are the latest posted results:
| 04/20/21 | Prior Prices | ||||
| Fund | G Fund | F Fund | C Fund | S Fund | I Fund |
| Price | 16.5671 | 20.673 | 61.8208 | 80.9492 | 37.7731 |
| $ Change | 0.0007 | 0.0308 | -0.4213 | -1.2900 | -0.5754 |
| % Change day | +0.00% | +0.15% | -0.68% | -1.57% | -1.50% |
| % Change week | +0.02% | +0.06% | -1.20% | -2.80% | -1.10% |
| % Change month | +0.09% | +0.91% | +4.14% | +1.21% | +3.10% |
| % Change year | +0.36% | -2.47% | +10.57% | +9.09% | +6.74% |
| Fund | L INC | L 2025 | L 2030 | L 2035 | L 2040 |
| Price | 22.7551 | 11.6363 | 40.8602 | 12.2467 | 46.2527 |
| $ Change | -0.0532 | -0.0576 | -0.2639 | -0.0870 | -0.3595 |
| % Change day | -0.23% | -0.49% | -0.64% | -0.71% | -0.77% |
| % Change week | -0.29% | -0.63% | -0.82% | -0.91% | -0.99% |
| % Change month | +0.89% | +1.68% | +2.12% | +2.31% | +2.50% |
| % Change year | +2.14% | +4.27% | +5.37% | +5.86% | +6.36% |
| Fund | L 2045 | L 2050 | L 2055 | L 2060 | L 2065 |
| Price | 12.6504 | 27.6692 | 13.5231 | 13.523 | 13.5229 |
| $ Change | -0.1057 | -0.2475 | -0.1490 | -0.1490 | -0.1489 |
| % Change day | -0.83% | -0.89% | -1.09% | -1.09% | -1.09% |
| % Change week | -1.07% | -1.14% | -1.39% | -1.39% | -1.39% |
| % Change month | +2.66% | +2.81% | +3.31% | +3.31% | +3.31% |
| % Change year | +6.77% | +7.21% | +8.95% | +8.95% | +8.95% |