Good Evening,
No rebound today! It was ugly out there for a while but improved into the close. One thing that I have noticed since the first of the year is that the Biotech sector has lead the market up and down in flamboyant fashion and biotechs got slammed today. So why didn’t you sell, you say? Simple as they say past performance doesn’t guarantee future results. That doesn’t mean that we shouldn’t pay attention to such signals and increase our vigilance. It just means that nobody knows for sure.
As I have often said, steer clear of anyone that claims to know the future. They are guessing. It may be an educated guess, but it is still a guess. That is why we call ourselves reactive traders. We watch our charts and react to the action that we see before us, plain and simple.
Today’s selling left us with the following results: Our TSP allotment out performed adding +0.337% while AMP under-performed at -0.905%. For comparison the Dow lost -0.44%, the Nasdaq -0.42%, the S&P 500 -0.40%, AT&T +0.74%, Alaska Air -3.29%, Facebook -0.6% and Apple slipped -0.14%. The market did manage to come off its lows for the day and seasonality remains positive so with God’s help we may have a good month yet.
The day’s action left us with the following signals: C-Neutral, S-Neutral, I-Neutral, F-Buy. We are currently invested at 05/C, 32/S, 63/I. Our allocation is now +1.75% on the year, not including the today’s gains. Here are the latest posted results.
| 03/31/15 |
|
|
|
|
| Fund |
G Fund |
F Fund |
C Fund |
S Fund |
I Fund |
| Price |
14.6845 |
17.0842 |
27.4284 |
38.2516 |
25.5993 |
| $ Change |
0.0008 |
0.0268 |
-0.2400 |
-0.1546 |
-0.3001 |
| % Change day |
+0.01% |
+0.16% |
-0.87% |
-0.40% |
-1.16% |
| % Change week |
+0.02% |
+0.12% |
+0.35% |
+0.85% |
-1.09% |
| % Change month |
+0.16% |
+0.47% |
-1.57% |
+1.24% |
-1.43% |
| % Change year |
+0.47% |
+1.68% |
+0.97% |
+5.39% |
+5.70% |
| |
L INC |
L 2020 |
L 2030 |
L 2040 |
L 2050 |
| Price |
17.6309 |
23.335 |
25.3877 |
27.0809 |
15.4018 |
| $ Change |
-0.0286 |
-0.1025 |
-0.1423 |
-0.1724 |
-0.1123 |
| % Change day |
-0.16% |
-0.44% |
-0.56% |
-0.63% |
-0.72% |
| % Change week |
+0.04% |
+0.02% |
+0.03% |
+0.05% |
+0.04% |
| % Change month |
-0.07% |
-0.44% |
-0.58% |
-0.64% |
-0.76% |
| % Change year |
+1.03% |
+1.91% |
+2.34% |
+2.66% |
+2.96% |
Let’s take a look at the charts:
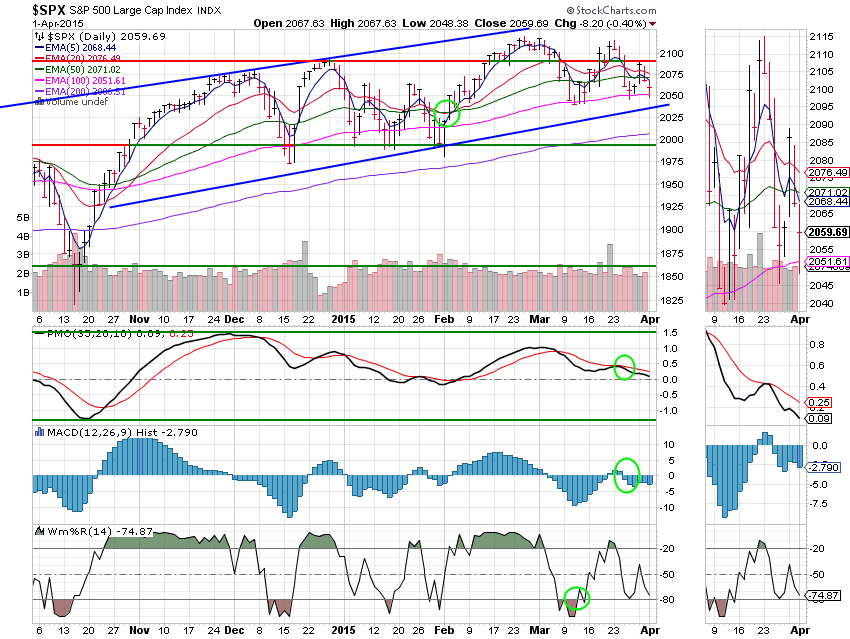
C Fund: This chart continues to weaken as price again closed below its 50 EMA. Enough of that action and it will pull this chart into a sell signal. It is safe for now, but it needs to show some strength to avoid a sell signal in the coming week. Our current allocation to this fund is only 5% which is a reflection of its current weakness. On a positive note, price remains well within the ascending channel. In other words, as tough as it may look the trend is still up! Signals are annotated with green circles.
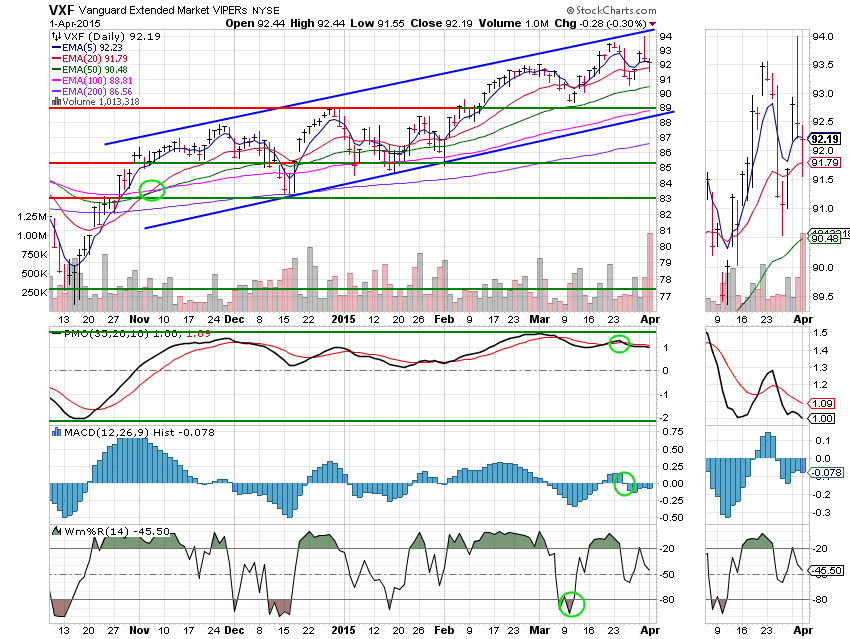
S Fund: This small cap dominated fund remains in better shape than the large cap C fund. Price has managed to remain above its 20 EMA and the Williams %R is keeping its distance from -80. The action in the S Fund acts more like consolidation than deterioration. The action in this fund leads me to believe that this market may not be done, as small caps always out-perform big caps in a bullish market and as I pointed out earlier, the trend is still up! On the bearish side, volume spiked today and that is never a good thing on a down day. We’ll keep an eye on the price volume ratio. Price/volume is the main indicator for a lot of people and those people would read a spike in volume on a down day as an initiation signal. In other words, a prelude to more negative action. The train of thought is that the big funds leave a footprint when they sell and that footprint is a spike in volume. While I do watch the price volume ratio as an indicator, it is the fourth thing that I choose to watch. Price can still move up on low volume and just because some money moved out of small caps isn’t a reason to sound the alarm. For instance, it could be moving into large cap high dividend paying stocks such as AT&T which is something that a lot of fund managers tend to gravitate to when things get choppy and right now they are definitely choppy. Nevertheless, the high volume on an off day should raise our level of vigilance! Signals are annotated with green circles.
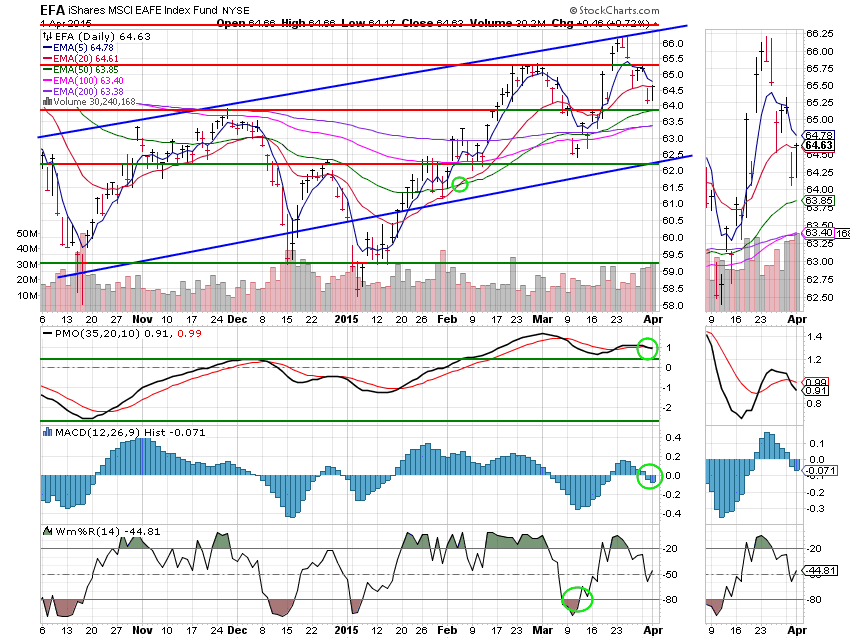
I Fund: I know that one of the resistance lines is right through the numbers on this chart so I’ll tell you that the I Fund with 63% of our allocation out-performed at +0.72%. I suspect that some of the ECB stimulus is starting to kick in and is aiding the I Fund. The dollar was flat today which also helped. Price regained its 20 EMA and the Williams %R turned up, both of which are bullish for this fund. Signals are annotated with green circles.
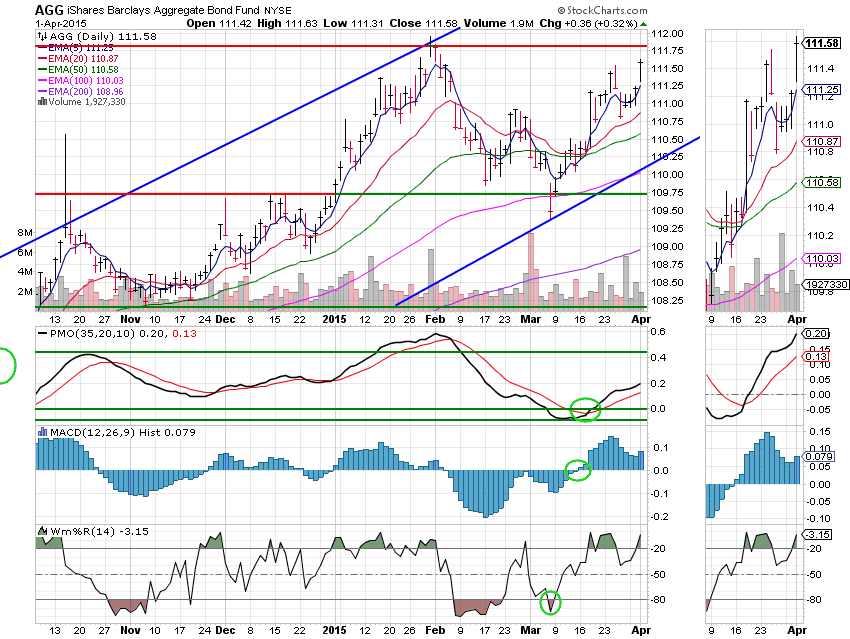
F Fund: The F Fund has been solid in the last week. No doubt, its initial strength was a good indicator of the current weakness in stocks. That said, it’s getting a little overbought so perhaps well get another run in stocks. This chart continues to strengthen so (other than a possible interest rate hike being on the table) I have no concerns with this fund. As we say, it is behaving well! Signals are annotated with green circles.
OK, April started with a bust, but seasonality is still with us so I’m still optimistic that we’ll have a good month. What else can I say? We’ll continue to seek God’s guidance and watch our charts.
Have a great evening!
God bless, Scott