Good Evening,
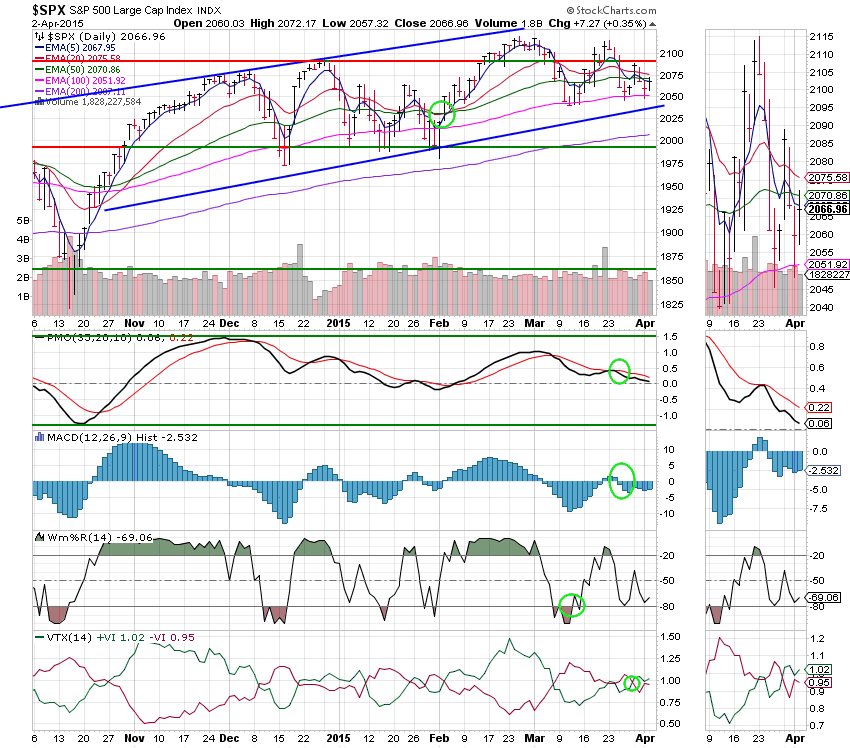
The market managed a lethargic bounce today ending a two day slide. Volume was fairly low which tells me that a lot of traders cut out early for Good Friday. It closed fairly well and that may have been due to market players trying to position themselves before Friday’s jobs report. Even though the market will be closed, the report will still be issued so it will be Monday before traders can react. The report is supposed to come in at around 244,000 jobs created which will be down from what we had in February. That said, I won’t even try to guess what the market’s reaction to the news will be. Hopefully, the money that pushed the market higher today was smart money. In other words, for those of you new to the game, the buyers knew what they were doing and were buying for a reason. We will see on Monday! One disturbing trend during the past few weeks that continued into today was the under-performance of the Transportation sector. The Transportation sector is one that a lot of analysts watch as it usually leads the market higher during bull runs and lower during dips. It’s too early to say if that’s the case this time,but it is worth watching.
The day’s action left us with the following results: Our TSP allotment out performed at +0.706% and AMP got back on track at +0.442%. For comparison, the Dow added +0.37%, the Nasdaq +0.14%, the S&P +0.35%, AT&T +0.73%, Alaska Air -1.45%, Facebook -0.13% and Apple closed at +0.86%. I thank God for a good day!
Wall St. climbs after two-day decline; jobless data boosts
| 04/01/15 | |||||
| Fund | G Fund | F Fund | C Fund | S Fund | I Fund |
| Price | 14.6852 | 17.1365 | 27.3231 | 38.1553 | 25.635 |
| $ Change | 0.0007 | 0.0523 | -0.1053 | -0.0963 | 0.0357 |
| % Change day | +0.00% | +0.31% | -0.38% | -0.25% | +0.14% |
| % Change week | +0.03% | +0.43% | -0.03% | +0.60% | -0.95% |
| % Change month | +0.00% | +0.31% | -0.38% | -0.25% | +0.14% |
| % Change year | +0.47% | +1.99% | +0.58% | +5.12% | +5.85% |
| L INC | L 2020 | L 2030 | L 2040 | L 2050 | |
| Price | 17.6267 | 23.3151 | 25.3582 | 27.0433 | 15.3773 |
| $ Change | -0.0042 | -0.0199 | -0.0295 | -0.0376 | -0.0245 |
| % Change day | -0.02% | -0.09% | -0.12% | -0.14% | -0.16% |
| % Change week | +0.01% | -0.07% | -0.08% | -0.09% | -0.12% |
| % Change month | -0.02% | -0.09% | -0.12% | -0.14% | -0.16% |
| % Change year | +1.01% | +1.82% | +2.23% | +2.52% | +2.80% |
Vortex IndicatorDeveloped by Etienne Botes and Douglas Siepman, the Vortex Indicator consists of two oscillators that capture positive and negative trend movement. In creating this indicator, Botes and Seipman drew on the work of Welles Wilder and Viktor Schauberger, who is considered the father of implosion technology. Despite a rather involved formula, the indicator is quite straightforward to understand and easy to interpret. A bullish signal triggers when the positive trend indicator crosses above the negative trend indicator or a key level. A bearish signal triggers when the negative trend indicator crosses above the positive trend indicator or a key level. The Vortex Indicator is either above or below these levels, which means it always has a clear bullish or bearish bias. Calculation of the Vortex Indicator (VTX) can be divided into three parts. First, calculate the positive and negative trend movements based on the highs and lows of the last two periods. Positive trend movement is the distance from the current high to the prior low. The further the current high is from the prior low, the more positive the trend movement. Negative trend movement is the distance from the current low to the prior high. The further the current low is from the prior high, the more negative the trend movement. These periodic values are then summed based on the indicator setting, which is the usually 14 periods. The second part involves the True Range, which was created by Welles Wilder. This indicator uses the current high, current low and prior close to measure volatility. See the formula box below for details. The third part normalizes the positive and negative trend movements by dividing them by the True Range. In effect, the Vortex Indicator shows volatility-adjusted positive trend movement and volatility-adjusted negative trend movement. The end result creates to indicators that oscillate above/below 1.