
Good Evening, Stocks gapped up again this morning led by materials and energy. However, they dropped into the red early in the afternoon. At that time the Pavlovian response kicked in and the dip buyers started buying. By the time we reached the close we were just off the highs for the day. The bears keep telling us that the market is going to take a big hit with all the negative issues out there. And you know what?? Sooner or later they will be right. There’s no question about that. The question is, how much money will they lose before that time comes? At this time our charts tell us that the trend is up. I said it yesterday and I’ll say it again today. It doesn’t matter what the bears or the bulls say. What does matter is that the trend is your friend and right now the trend is up!
The days trading left us with the following results: Our TSP allotment added another +0.31%. For comparison, the Dow was up +0.27%, the Nasdaq dropped -0.40%, and the S&P 500 gained +0.31%. We were on the right side of the trade for another day. I thank God for His continued guidance of our group! Now here’s the news:
Wall Street nears record as quarterly reports roll in
The days action left us with the following signals: C-Buy, S-Neutral, I-Neutral, F-Buy. We are currently invested at 100/C. Our allocation is now +4.98% on the year not including the days results. Here are the latest posted results:
| 04/18/16 | Prior Prices | ||||
| Fund | G Fund | F Fund | C Fund | S Fund | I Fund |
| Price | 15.0008 | 17.5451 | 28.4368 | 35.7377 | 24.1196 |
| $ Change | 0.0021 | -0.0125 | 0.1852 | 0.1899 | 0.0786 |
| % Change day | +0.01% | -0.07% | +0.66% | +0.53% | +0.33% |
| % Change week | +0.01% | -0.07% | +0.66% | +0.53% | +0.33% |
| % Change month | +0.08% | +0.34% | +1.78% | +2.14% | +2.39% |
| % Change year | +0.57% | +3.48% | +3.17% | +1.43% | +0.10% |
| L INC | L 2020 | L 2030 | L 2040 | L 2050 | |
| Price | 17.9706 | 23.5466 | 25.4977 | 27.0626 | 15.3104 |
| $ Change | 0.0206 | 0.0583 | 0.0874 | 0.1072 | 0.0686 |
| % Change day | +0.11% | +0.25% | +0.34% | +0.40% | +0.45% |
| % Change week | +0.11% | +0.25% | +0.34% | +0.40% | +0.45% |
| % Change month | +0.49% | +0.98% | +1.34% | +1.54% | +1.74% |
| % Change year | +1.11% | +1.46% | +1.73% | +1.85% | +1.89% |
Now lets take a look at the charts. All signals are annotated with green circles. If you click on the charts they will become larger.
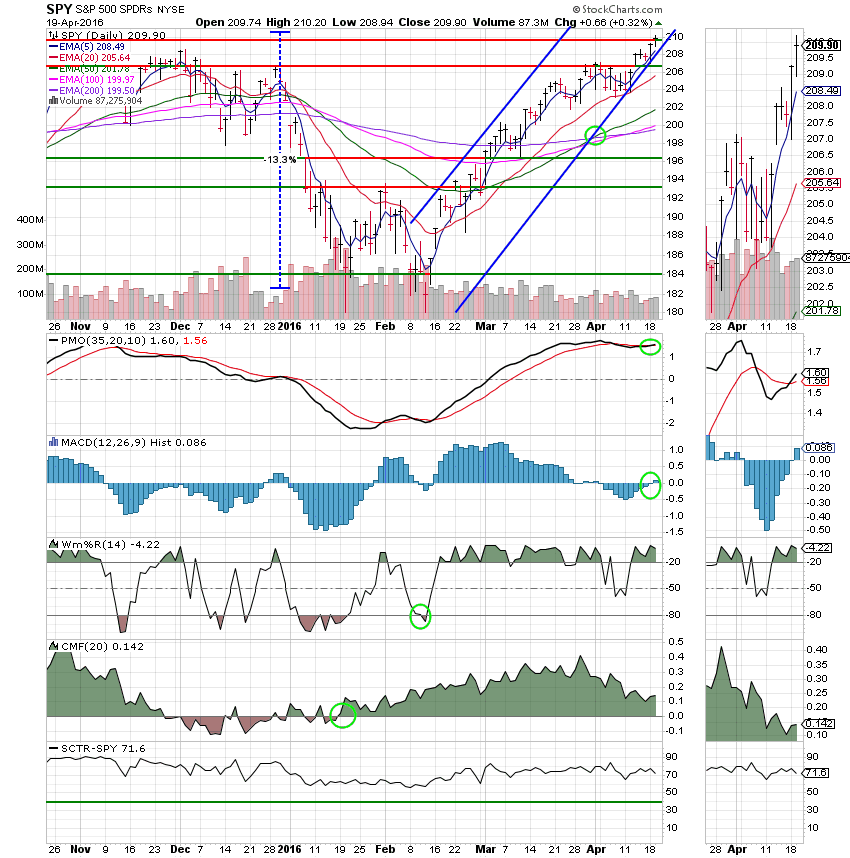
C Fund: Price tested and then closed right at resistance at 209.90. Price continues to hug the lower trend line as it rises. We’ll be in good shape as long as this trend line is not violated.
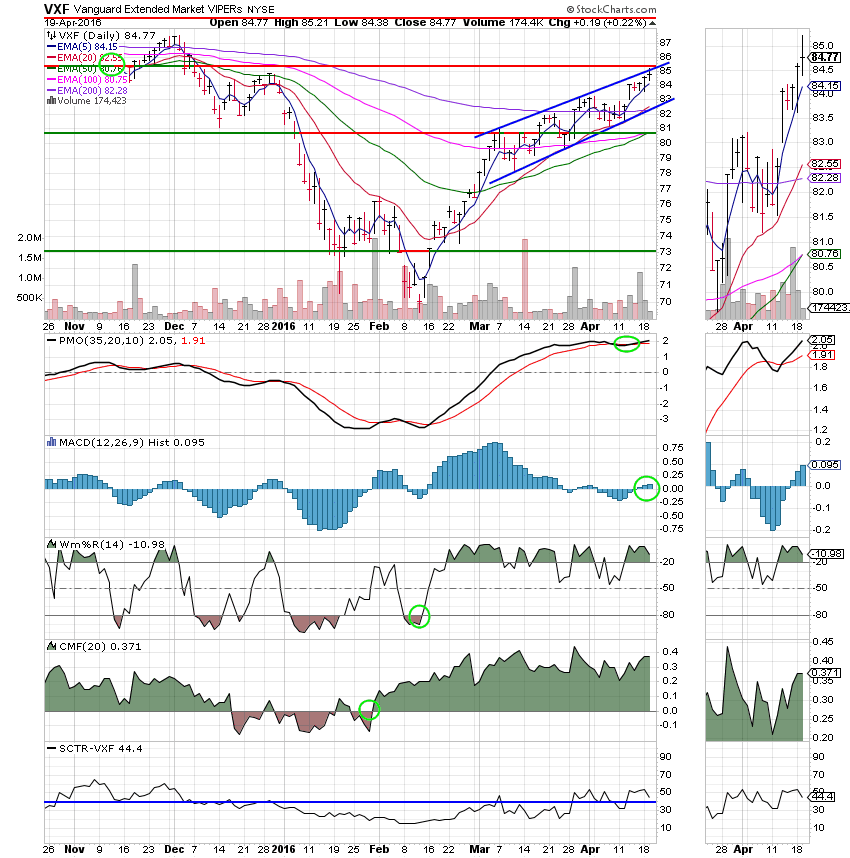
S Fund: The 20 EMA passed up through the 200 EMA. This is bullish. Price continues to travel up the ascending channel.
I Fund: The I Fund had an awesome day. But as I mentioned before it has the most damage to repair. Price is closing in on resistance at 60.10. If that is breached the next resistance is at a little over 62. Of note is that the SCTR moved back up above 40 for the first time since January. This is a good sign for the I Fund and possibly for stocks in general. 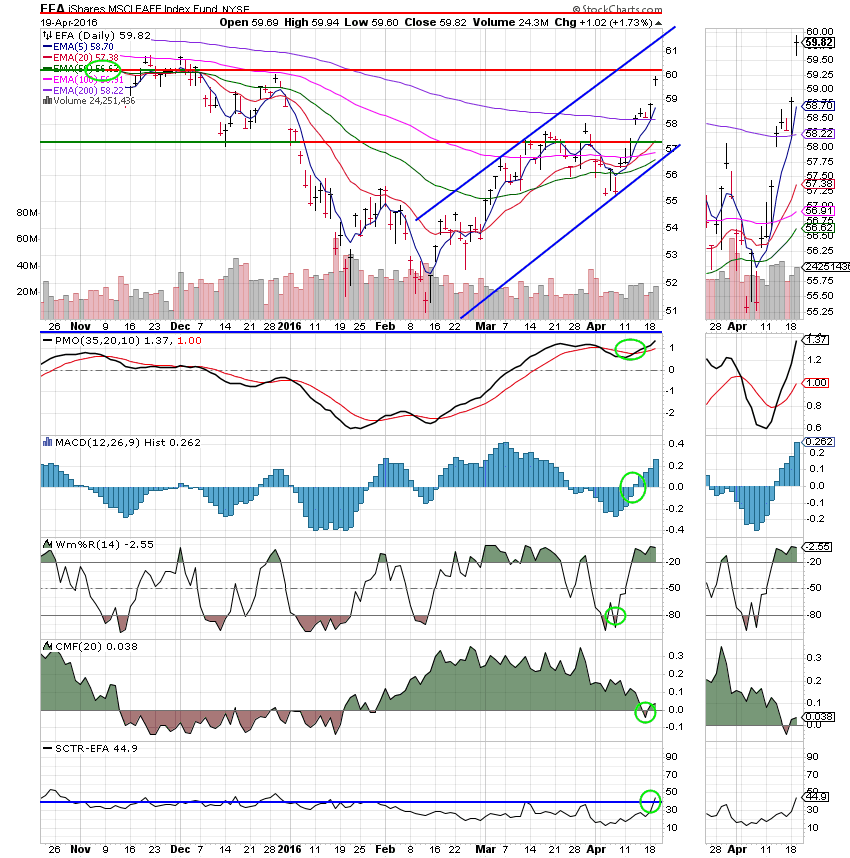
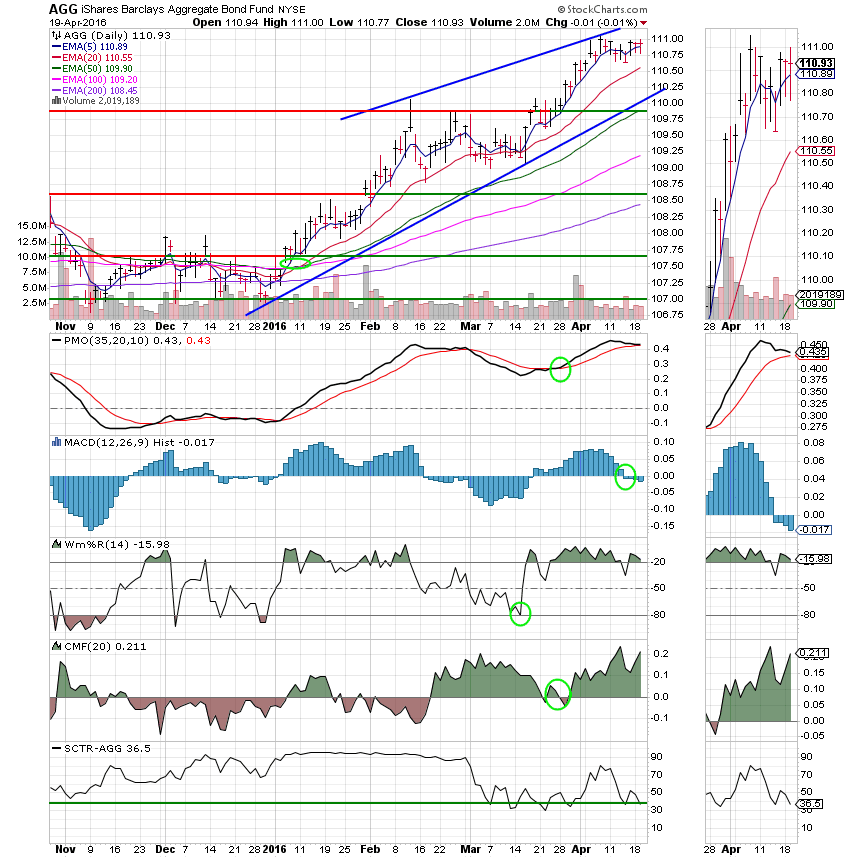
F Fund: Price remains within it’s established channel. However, as I mentioned last night, this chart is getting weaker. The PMO is approaching a negative crossover, the MACD is negative and dropping, and worst of all the SCTR has dropped to 36.5. When taken as a whole, this tells us that the current buy signal is getting long in the tooth. It also tells us that there is probably some more up side for stocks. Normally speaking, When bonds go down, stocks go up!
Right now, I’m very comfortable with our current allocation. The C Fund has an SCTR (Stock Charts Technical Ranking) of 71.6 which is the best out of all of our TSP charts. Until our charts change, we’re on cruise control. Have a nice evening and may God continue to bless your trades!