Good Evening,
The market loves central banks even if they are not in the US. Today, or should I say last night, China reduced the amount of money that its banks would be required to keep. The thought behind this is that the banks will lend the now-free money out, which will act as stimulus to their economy. Since it is now a globally connected economy, markets around the world cheer any time a major central bank puts any type of stimulus in place. That was all our market needed to shoot out of the gates and it never looked back. Many traders figured with a lot of tech earnings coming up this week that the market will continue to rise without them so they’d better get in and thus, today’s rally was born.
The day’s buying left us with the following results: Our TSP allotment gained +0.343% which would have been more had today’s strong dollar not hurt the I Fund. For comparison the Dow added +1.17%, the Nasdaq +1.27%, and the S&P 500 +0.92%. Hey, a gain is a gain and I’ll thank God for it! The I Fund has had many good days recently so we can’t complain.
Wall St rallies on China stimulus ahead of tech earnings
The day’s action left us with the following signals: C-Buy, S-Neutral, I-Buy, F-Buy. We are currently invested at 05/C, 32/S, 63/I. We normally rebalance our allocation on or about the 25th of each month to keep it in line with current results. Our allocation is now +3.52% on the year not including the day’s results. Here are the latest posted results:
| 04/17/15 | |||||
| Fund | G Fund | F Fund | C Fund | S Fund | I Fund |
| Price | 14.6973 | 17.1688 | 27.6242 | 38.3095 | 26.2768 |
| $ Change | 0.0008 | 0.0165 | -0.3161 | -0.5187 | -0.2223 |
| % Change day | +0.01% | +0.10% | -1.13% | -1.34% | -0.84% |
| % Change week | +0.04% | +0.45% | -0.98% | -1.01% | -0.24% |
| % Change month | +0.09% | +0.50% | +0.71% | +0.15% | +2.65% |
| % Change year | +0.55% | +2.18% | +1.69% | +5.55% | +8.50% |
| L INC | L 2020 | L 2030 | L 2040 | L 2050 | |
| Price | 17.6871 | 23.4921 | 25.5963 | 27.325 | 15.5594 |
| $ Change | -0.0369 | -0.1262 | -0.1804 | -0.2247 | -0.1449 |
| % Change day | -0.21% | -0.53% | -0.70% | -0.82% | -0.92% |
| % Change week | -0.11% | -0.34% | -0.46% | -0.55% | -0.63% |
| % Change month | +0.32% | +0.67% | +0.82% | +0.90% | +1.02% |
| % Change year | +1.35% | +2.59% | +3.19% | +3.59% | +4.02% |
Let’s take a look at the charts:
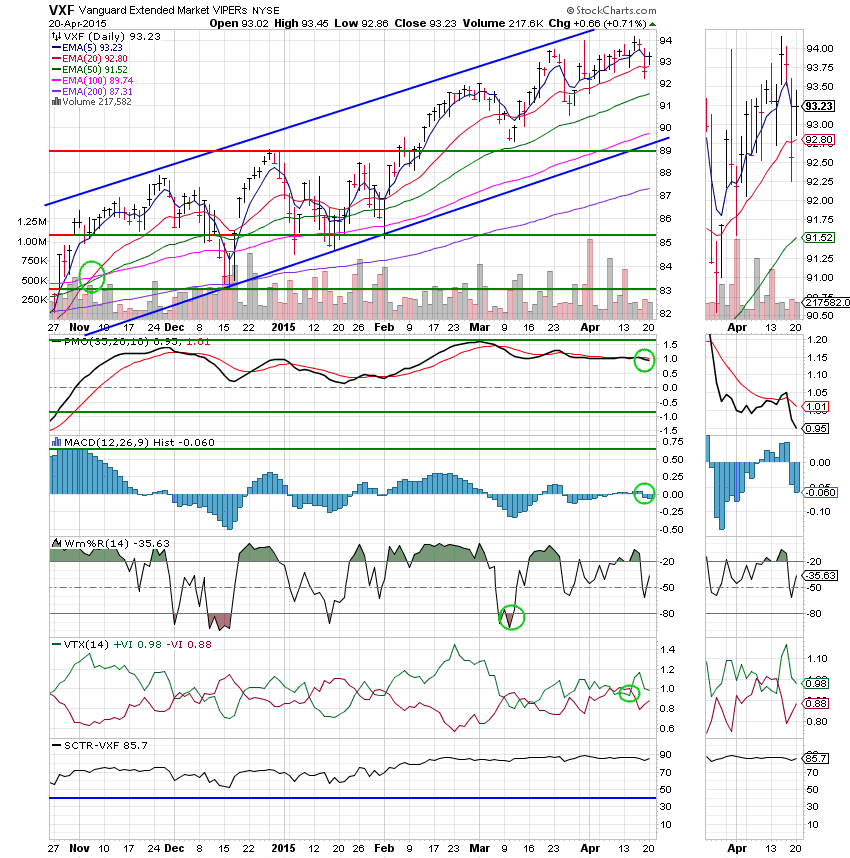
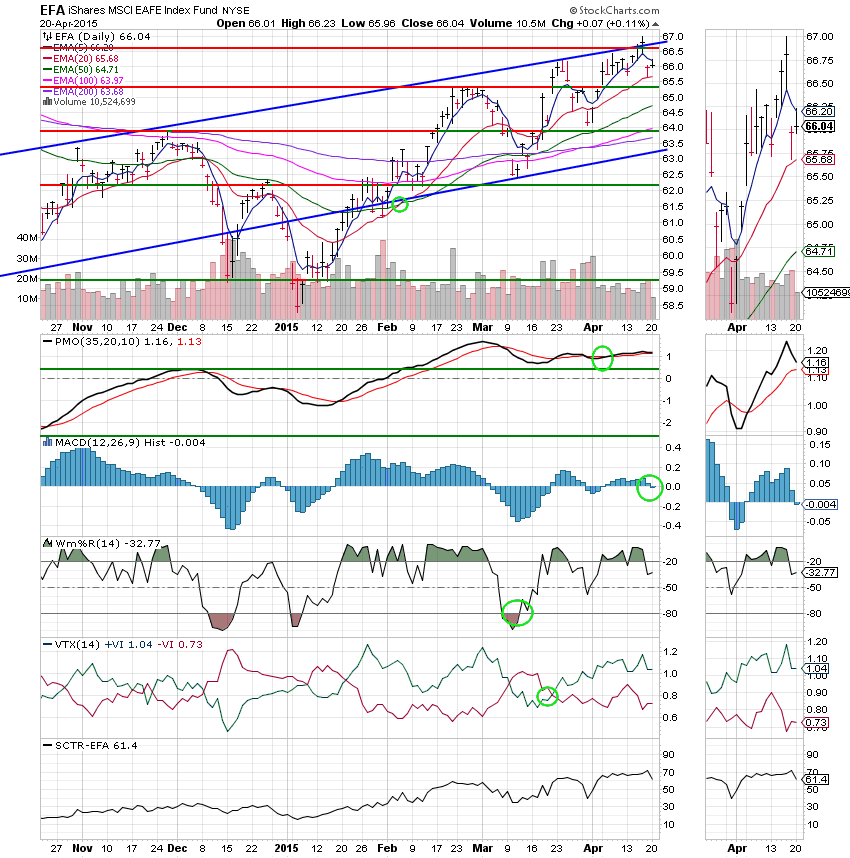
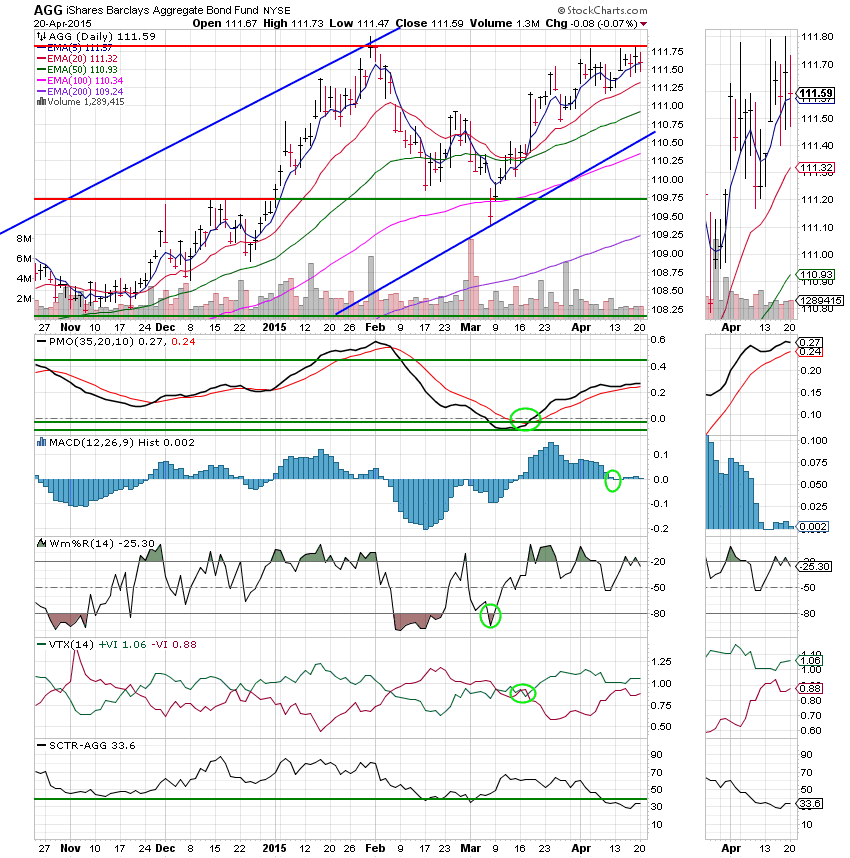
I added another indicator at the bottom of the charts. It is called the SCTR, which stands for the Stock Charts Technical Rank. I use several from time to time. This indicator is one that was developed at Stockcharts.com, which is the charting service that I use. Without getting into it too deep, here is a brief explanation of what it is and what it does: From a technical perspective, the StockCharts Technical Rank (SCTR) makes a TON of sense. It’s a very quick way to see how a stock is performing relative to its peers (ie, large cap, mid cap, small cap). These rankings are based on technical scores developed by John Murphy and they take into account long-term, mid-term, and short-term technical indicators with the majority of the weighting on the long-term indicators. This also makes perfect sense in my view because the longer-term trend is much more powerful and meaningful than its shorter-term counterparts. But the mid-term and short-term do influence the results to a degree. Generally, the stocks with the highest SCTR rankings will boast superior technical results across all time frames. Most of the technicians that watch this indicator agree that anything lower than 40 is bad. I marked the 40 area on a couple of our charts. It helps to see at a glance how a particular stock of fund is doing.
C Fund: The C Fund regained most of the ground that it lost on Friday. Price closed back above its 20 EMA and resistance near 2093. This chart remains on a buy signal with our four indicators in positive configurations. Since the SPX is and index the SCTR does not register on this chart. If I continue to watch the SCTR, I will chart the SPY which is the ETF version of this index.
S Fund: Price closed back above its 20 EMA and remains well positioned within its ascending channel. The chart remains at neutral with the PMO and MAC D giving sell signals. For those of you that are new to this blog, we utilize four indicators: Price Exponential Moving Averages, the PMO, the MAC D, and the Williams %R. When two or more are negative, we call it neutral. We need all four to go negative for a sell. We are a little more flexible on the buy signal depending on whether or not we are in a bull market. I explain that when it’s relevant….
I Fund: The I Fund suffered from a strong dollar today. Live by the sword, die by the sword I guess. Price did manage a gain and remains above its 20 EMA and within its ascending channel. This chart remains on a buy signal, but is weakening with the MAC D now in a negative configuration and the PMO turning down. Should the PMO cross down through its EMA, a neutral signal will be generated for this chart.
F Fund: Price remains in a tight trading range in the 1150 -1160 area as it stalls at resistance at the 1180 area. We mentioned in the last blog that this would be a tough area for the F Fund to breach. That said, this fund still remains on a buy signal. Of note is the fact that our new indicator (SCTR) is below 40 which indicates significant weakness. Were I comparing bond funds with the idea of investing in one, I would not invest in the F Fund based on this SCTR. For the purpose of our analysis in TSP, we will read this as an indication that there is enough weakness here to indicate that our equity based funds may give us a better opportunity for gains. You will notice that the S And I Funds both have an SCTR well above 40.
We have more earnings on the way that will likely be a catalyst for market movement. I am optimistic that based on today’s action, that movement will be up. As usual we’ll keep watching our charts and trusting in God. May He continue to bless your trades. Have a great evening! God bless, Scott![]()


