
Good Evening,
It’s not a question of if we are in a sell off because we are. The question is how deep will it go? We had warning signs in bio-techs and small caps that we talked about in recent blogs and once again they turned out to be accurate. Our Canary in the coal mine is now dead! With the selling in progress, our job is to monitor our charts and make sure things don’t get out of hand. We must be disciplined and sell when we get sell signals.
One thing to keep in mind is that, although the selling seems a little more serious this time, for the past 3 years we have bounced back quickly from all dips. As I have pointed out many times, we haven’t had a true correction (defined as 10% or more) during that entire period. When trading stocks, a pattern usually lasts until it’s broken; this one has not been broken yet.
Our job once again is to manage our positions and not sell prematurely, but only when we get a sell signal using the indicators that have worked for us during this period. We will follow our charts and not our hearts! Emotion will get you killed in this game to be sure!
The day’s selling was not pretty! It left us with the following results: (Close your eyes if you can’t stand the sight of blood!) Our TSP allotment fell back -1.0975%. For comparison, the Dow lost -1.08%, the Nasdaq -1.64%, and the S&P 500 -1.01%. There was a lot of red on the screens. Thank God that we hung in there with the major indices!
Wall St. drops with tech shares; indexes up for month
The day’s action left us with the following signals: C-Neutral, S-Neutral, I-Buy, F-Neutral. We are currently invested at 23/C, 14/S, 63/I. Our allotment is now +5.06% on the year, not including today’s results. Here are the latest posted results:
| 04/29/15 | |||||
| Fund | G Fund | F Fund | C Fund | S Fund | I Fund |
| Price | 14.7063 | 17.0397 | 27.9746 | 38.2543 | 26.8547 |
| $ Change | 0.0007 | -0.0463 | -0.1036 | -0.2475 | -0.1557 |
| % Change day | +0.00% | -0.27% | -0.37% | -0.64% | -0.58% |
| % Change week | +0.03% | -0.53% | -0.50% | -1.40% | +0.14% |
| % Change month | +0.15% | -0.26% | +1.99% | +0.01% | +4.90% |
| % Change year | +0.61% | +1.42% | +2.98% | +5.39% | +10.89% |
| L INC | L 2020 | L 2030 | L 2040 | L 2050 | |
| Price | 17.7326 | 23.6445 | 25.8024 | 27.568 | 15.7197 |
| $ Change | -0.0186 | -0.0598 | -0.0849 | -0.1053 | -0.0675 |
| % Change day | -0.10% | -0.25% | -0.33% | -0.38% | -0.43% |
| % Change week | -0.11% | -0.24% | -0.33% | -0.41% | -0.45% |
| % Change month | +0.58% | +1.33% | +1.63% | +1.80% | +2.06% |
| % Change year | +1.61% | +3.26% | +4.02% | +4.51% | +5.09% |
Now let’s take a close look at the charts.
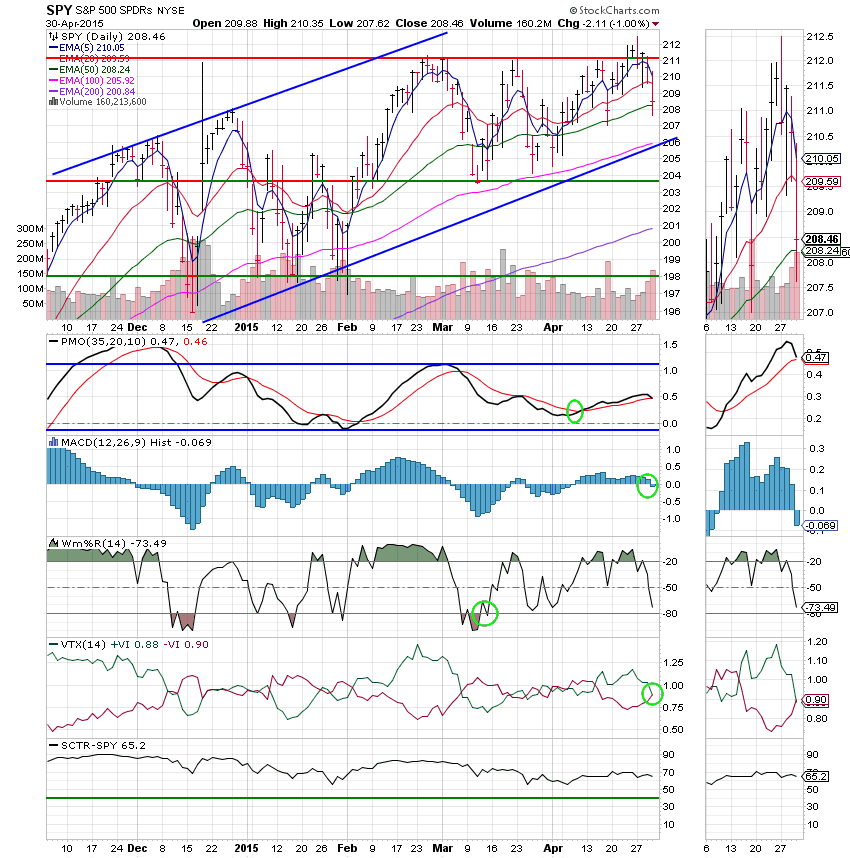
C Fund: Price dropped below its 20 EMA, but still managed to stay above its 50 EMA so no serious damage has been done yet. The C fund has gone to a neutral signal with the MACD and VTX moving into negative configurations.
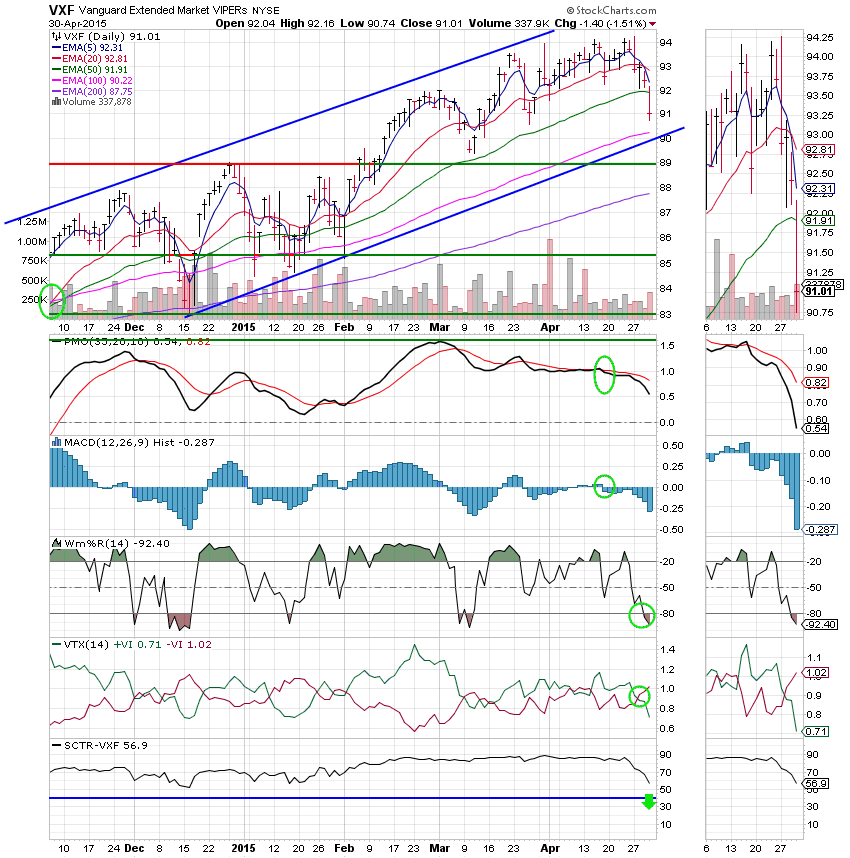
S Fund: Small caps and bio-techs continue to lead the market down in this sell off so it should be no surprise that the S Fund weakened today. Price closed below its 50 EMA and all five of our other indicators that are already in negative configurations continued to weaken! We mentioned yesterday that the Williams %R is extended to the downside so we are looking for an ultra short-term move up in the coming days.
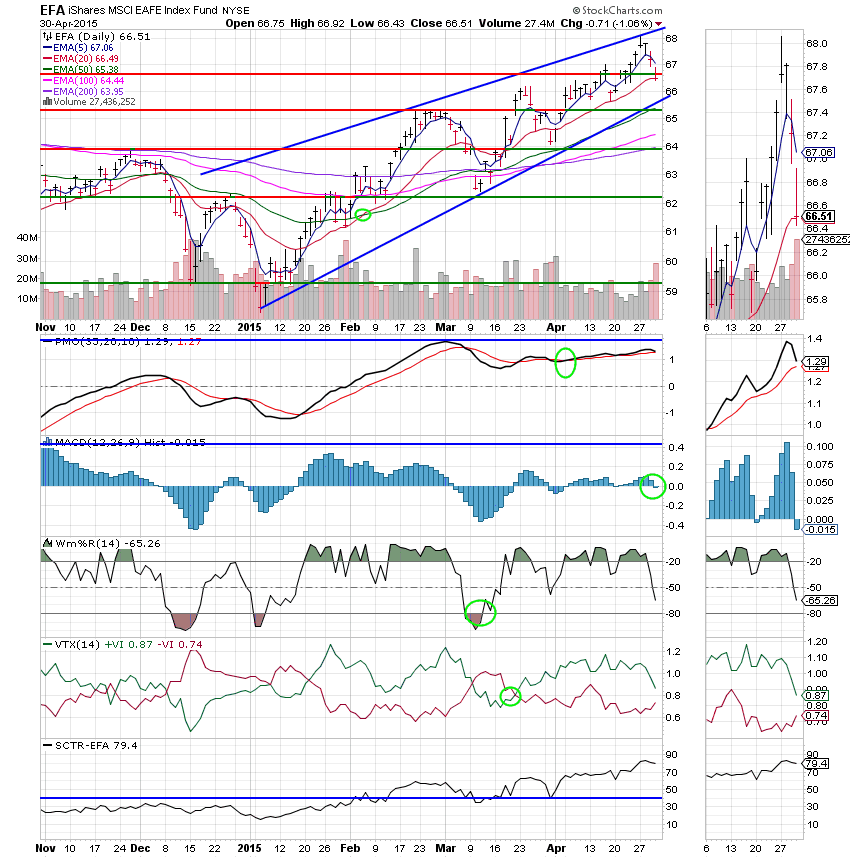
I Fund: The EFA took a nice hit today but it was in line with the C Fund and much better than the S Fund so we’ll take it. Price dropped back below support and closed right on its 20 EMA. The MAC D went negative with all the other indicators becoming weaker. Barring some very good price action tomorrow, this fund will generate a Neutral signal. If we make it through this sell-off without generating a sell signal that is really all we should expect. For now we remain on a buy signal, but not for long!
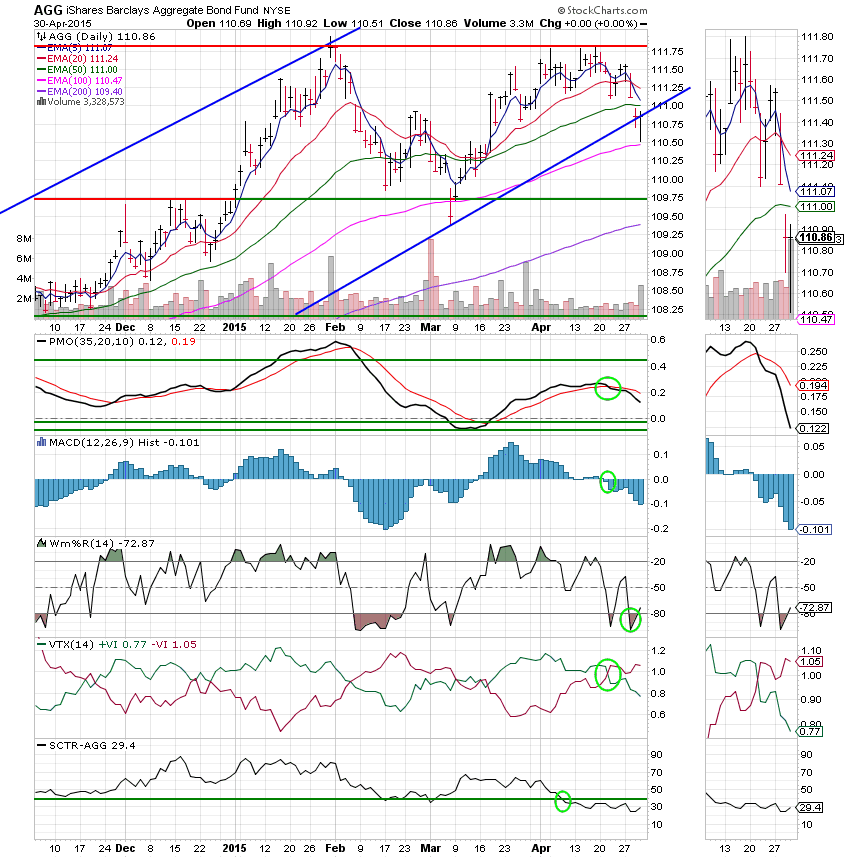
F Fund: The F Fund broke even today which really doesn’t say much for bonds when stocks are selling off so hard. Price tested support and then closed right on the lower trend line. One positive is that the Williams %R turned up indicating that a short term up trend may be in the cards for this fund. I am recommending the G Fund for those of you that are so inclined. This chart has a lot of work to do before I would feel secure with money here. A protracted down trend could change things a lot though….we’ll just have to watch the charts and play the action before us.
If this sell-off continues, it may make a nice opportunity in the future. If not we are well positioned to take advantage of another quick recovery. We’ll just have to watch the charts and see where they take us. Oh yes, and follow God and see where He guides us. He has never let this group down since 1997 and He won’t start now. Give Him all the Praise!!! Have a nice evening and I’ll see you tomorrow.
God bless,
Scott![]()