My TSP Guide:
Good morning mytspguide.com subscribers. My name is Todd Dudley, Financial Adviser with Raymond James Financial Services.
Even though I have been in the business since 1992, I feel I am trying to fill large shoes while standing in for Scott Grimes, as he takes a well-deserved vacation over these 2 weeks. For now, stay the course in regards to his last recommendation.
As Scott has shared with many of you, I am willing to assist you with any questions you may have beyond what Scott provides for you with his market updates and asset allocation guidance. Todd Dudley & Associates is whom Scott recommends to all Federal Employees who have questions beyond TSP. This could be applicable to assets held outside your TSP or those who are considering retiring soon or have already retired.
Allow me to share with you some up to date market facts, while considering the investment opportunities during life after TSP:
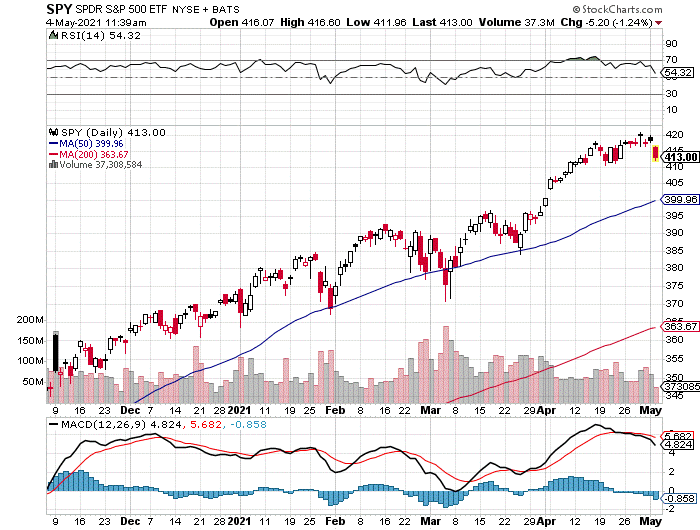
I would like to shine some light into your “C” Fund. As you know, the “C” fund represents the S&P 500. Which consists of most all the largest 500 companies in the USA. The S&P 500 is divided into 11 different sectors, as listed below. The weighting of each sectors is dramatically different. This is illustrated whereas Information Technology consists of approximately 27.6% of the stocks value within the index and Energy consists of only 2.3% of the index value, as indicated on the left.
Sector Weighting Sector YTD Results The S&P 500 is:
27.6 Information Technology 7.3%
13.4 Healthcare 7.3%
12.7 Consumer Discretionary 10.4%
10.8 Communication Services 16.6%
10.3 Financials 23.5%
8.5 Industrials 15.4%
6.6 Consumer Staples 3.4%
2.7 Utilities 7.2%
2.6 Materials 4.9%
2.4 Real Estate 18.1%
2.3 Energy 31.6%
100 S&P 500 11.8%
The set of numbers on the above right illustrates the results of each sector’s performance year-to-date. As you can see, the sector results within the C Fund are dramatic, ranging from +3.4% to +31.6%, with an average of +11.8%. As good as +11.8% year-to-date gain is, with some effort and active management your portfolio could have been invest in the sectors that outperformed the average. If that had been done, your year-to-date return would have been 20%.
This is always the case. During any period of time there will be some sectors out performing others and if adjustments are made, over time, you could achieve greater than average returns.
I have more to share with you next week, but this may be enough food for thought at this time.
If you have any questions about myself and my firm, Raymond James Financial Services, please ask Scott, after his vacation, or you may call us at (800) 261-0990, or email todd.dudley@raymondjames.com. We would be happy to answer any questions you may have.
Sincerely,
Todd Dudley
Registered Investment Adviser Representative
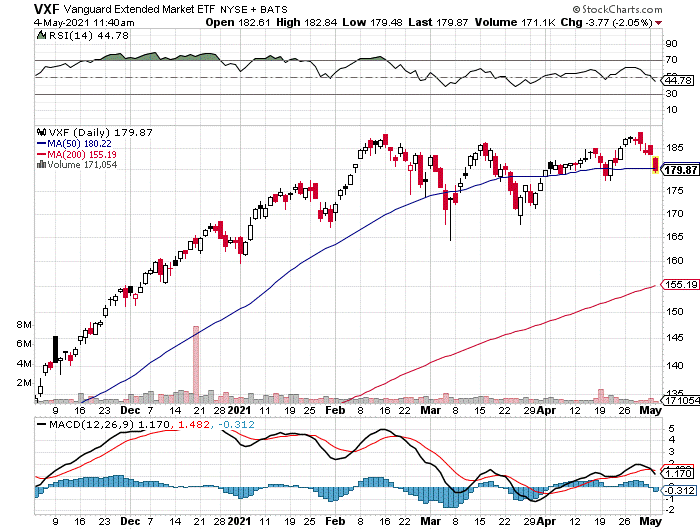
If you want to learn more about technical analysis check out the website StockCharts.com.
click on chart to enlarge