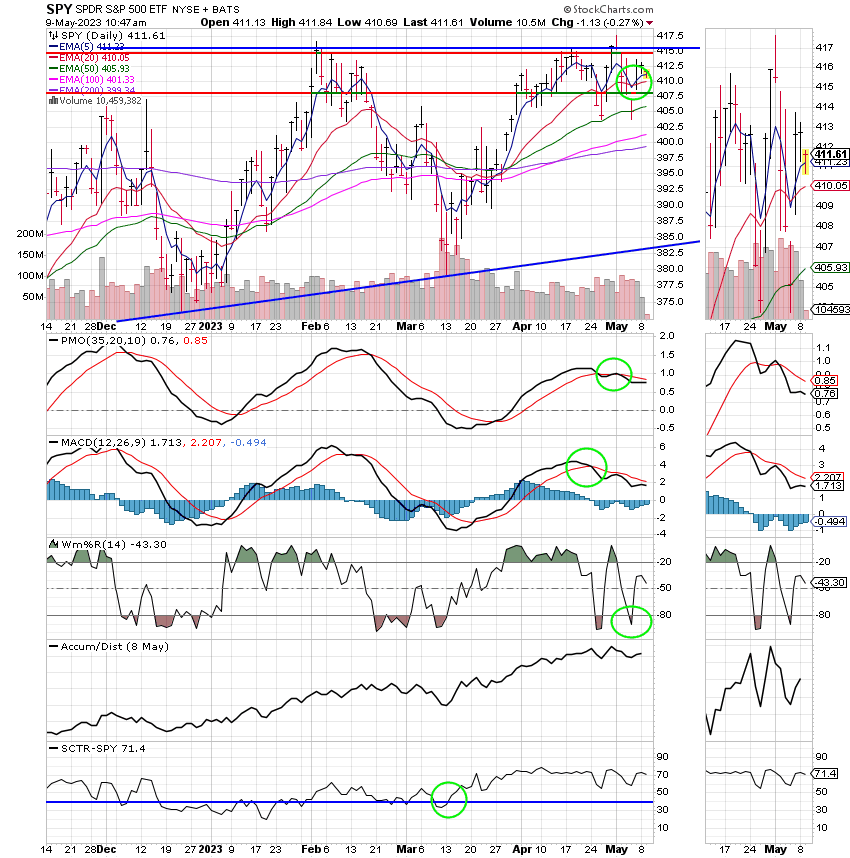
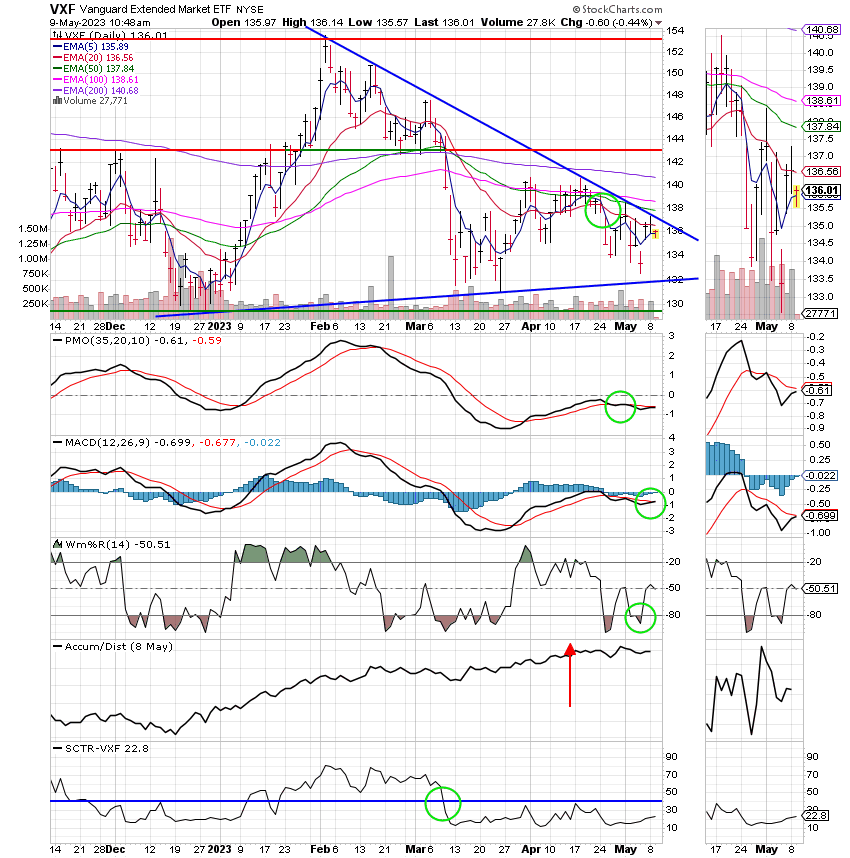
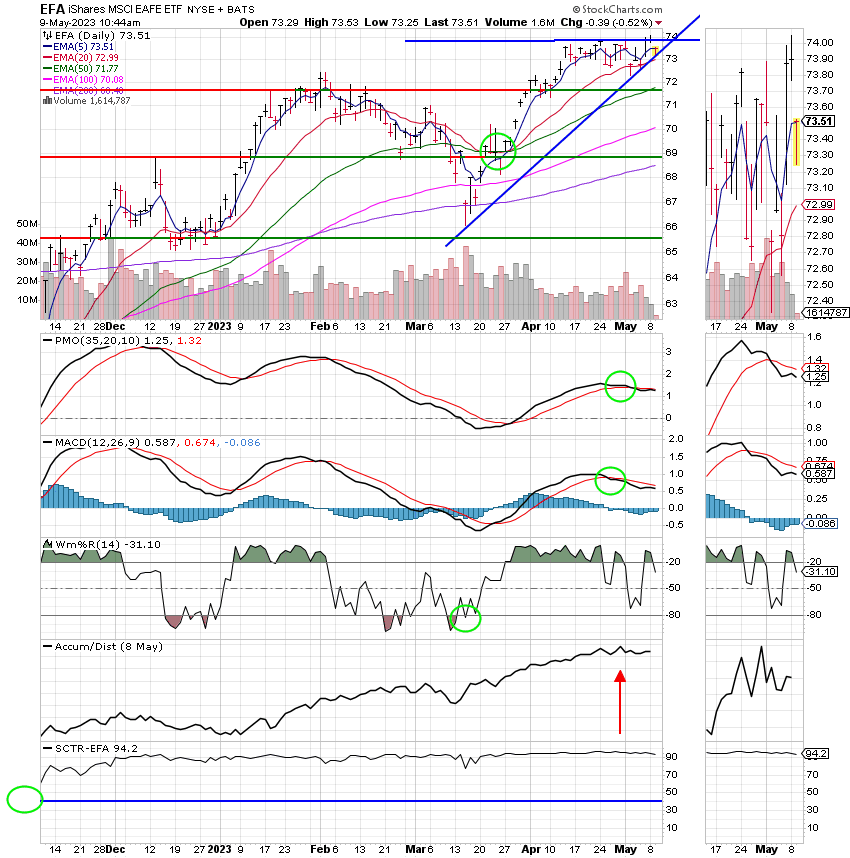
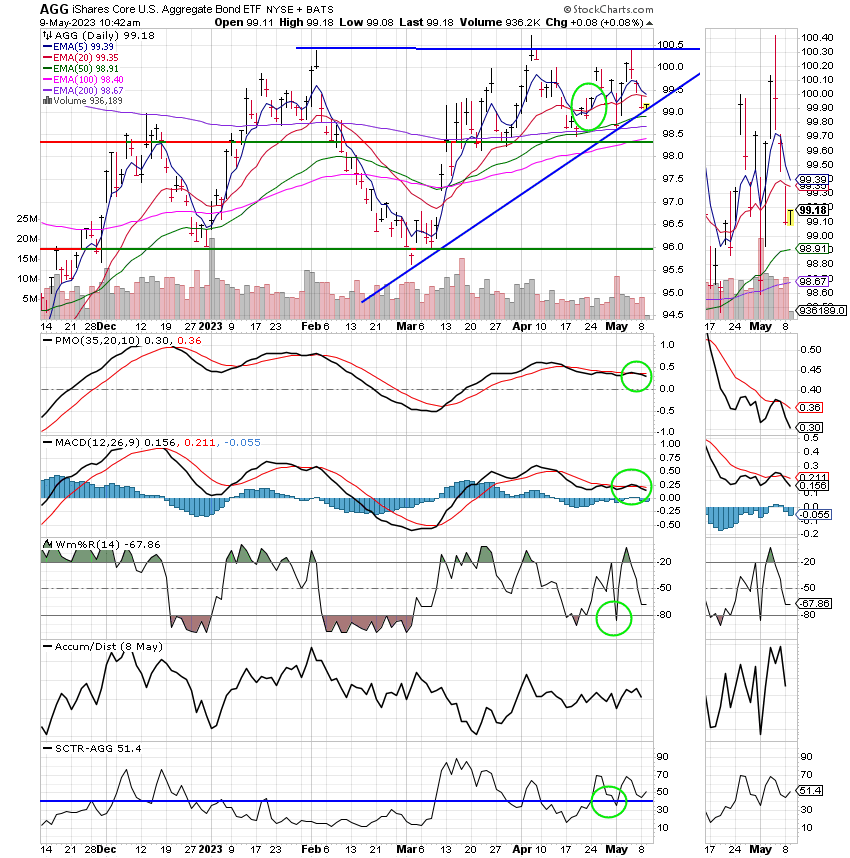
Good Morning, This market continues to be in a trading range with the S&P hanging out between 4075 and 4150 with all the usual give and take that goes along with it. Last week we had a couple more regional banks show some serious stress and the market sold off and then recovered as the situation with the banks eased up. All in all it ended up as a negative week for the major indices although there was a lot more movement than the final share prices reflected. We’ve started off this week somewhat flat as traders seem to be taking a break and not placing any big bets ahead of the CPI and PPI which will be released on Wednesday and Thursday respectively. Economist are expecting the the Consumer price index to be .04% higher than last month which if I am not incorrect was +0.02% higher. Of course the train of thought will be that the hot report will do little to dissuade the Fed from increasing rates again in June and nobody wants that. The majority of economists and investors believe that there will be a recession but they are unable to come to a consensus on whether it will be a mild or a deep recession. Many think that what the Fed does now will determine which one it is and fear that strong economic reports may push the Fed too far in their battle with inflation. A little over a week ago we moved to the G Fund as our equity based charts had became extended. While the market has let off a little steam we feel that there is still a high probability of a pullback given that our charts are remain close to overhead resistance. We feel that price could pull back from this resistance and give us a better entry point. We probably won’t consider buying at this level unless overhead resistance is broken and becomes support. Overhead resistance is currently around 4150 on the $SPX. There are other factors that we watch but the this is the main one right now. As of today overhead resistance has been tested four times and has not been broken. I would not be surprised to see a pullback at this point in the five to ten percent range which would give us a good entry point into one of our equity based funds. For those of you who are new to the game our equity based funds are the C, S, and I Funds. The bottom line is that investors are still trying to decide if the regional bank crisis is over. Personally, I don’t think we’ve seen the last of it and I’m treating Fridays rally as a bear market rally. Another issue that keeps me holding back is the recent performance or should I say lack of performance of small cap stocks. I have never seen a meaningful rally without small caps and right now they are showing little life. The chart for the IWM (Russel 2000) is totally upside down with the 5, 20, 50 and 100 EMA’s all lower than the 200 EMA. Until, I see some improvement in this index you can consider me skeptical of any rally. Nevertheless, I will say this concerning any pullback, I do not feel that the lows of last October will be retested and if I am wrong and they are I still believe they will hold. Again and let me be clear regarding the ”all clear” signal. Until I see small caps rallying with the rest of the market, I refuse to consider any rally as the beginning of a new bull market. That does not mean that I will not reenter the equity market if I see the opportunity to make a reasonably safe gain. However, it doesn’t look like we’ll get that opportunity unless the market can break out of the current trading range it has been in for a while now. Then there’s the elephant in the room that is the debt ceiling. Treasury Secretary Janet Yellen announced last week that the US Government could reach the current debt limit by June 1st. That doesn’t give congress much time to come to an agreement on a new debt ceiling. I don’t want to get into the politics of this any more than I have to, but at least to a certain extent it cannot be avoided. Politicians in congress have become more divided and given their extreme positions on the right and left I honestly don’t see in principle how they can agree on anything let alone an issue as big as the debt ceiling. Each year we go through this and each year they agree on spending cuts and then increase the debt ceiling. It seems like most of them hope to avoid the subject altogether during their lifetime. So they kick the can down the road and each year it’s rinse and repeat. Each year the choices become harder and harder. What years ago was essentially cutting and few pork barrel projects has now morphed into something much bigger. Why? The US Government is paying more and more interest each year. So that part of the debt keeps increasing. You already know the rest, as the debt on interest becomes larger the amount of money to be spent for the actual operation of the government becomes smaller. Any cuts that would be made now will surely have to effect some untouchable programs such as social security and Medicare. Then there are all the other issues such as Ukraine, the border crisis, and the crumbling infrastructure. These all cost money too!! So where does it end? Where to they cut? I’ve got several suggestions but that’s where it gets political. So I’ll leave that to you. It is imperative that congress come to an agreement and not just to increase the debt ceiling! They must come up with a comprehensive budget that funds the government and starts to reverse the ever growing debt. If they do not our debt will continue to increase until we can’t borrow enough money to cover the interest. Oh yeah, and while I’m at it did anyone consider the steps they will take to deal with the growing debt along the way?? Of course they will be forced to increase revenue. They will do this by increasing taxes on individuals as well as businesses. It is utter madness to continue to increase the debt ceiling with no meaningful plan to reduce debt. To do so would meet the very definition of insanity which is to do the same thing and expect different results. Would you borrow more money in your household and not have a plan to pay it off???? There you go. Each year the market is effected negatively as congress struggles to come up with an agreement. This year will be no different. Therefore, you can add this to the other issues that need to be resolved before we can have a new bull market. The rate of inflation must come down to two percent, interest rates must decrease, we must get through a potential recession, and this. We must depend upon a group of politicians that cannot even speak civilly to one another to agree on a complicated issue like the debt ceiling. It says here that they’ll kick the can down the road yet another year, but not without some drama and not without a negative effect on the market. One thing is for sure though, eventually this debt will outstrip our ability to pay and when that day comes they will deal with it whether they want to or not. I pray for our representatives daily and I recommend that you all do so as well. Only if we turn wholly to God will this situation be resolved. ” If my people who are called by my name, shall humble themselves, and pray, and seek my face, and turn from their wicked ways; then I will hear from heaven, and will forgive their sin, and will heal their land.” 2 Chronicles 7
The days trading is generating the following results: Our TSP allotment is steady in the G Fund. For comparison, the Dow is trading lower at -0.14%, the Nasdaq -0..52%, and the S&P 500 -0.43%.
Stocks fall as investors await inflation data, debt ceiling progress: Live update
Recent action has left us with the following signals: C-Hold, S-Sell, I-Hold, F-Hold. We are currently invested at 100/G. Our allocation is now -2.32% on the year not including the days results. Here are the latest posted results:
| 05/08/23 | Prior Prices | ||||
| Fund | G Fund | F Fund | C Fund | S Fund | I Fund |
| Price | 17.4691 | 18.7848 | 63.832 | 63.46 | 38.08 |
| $ Change | 0.0053 | -0.0976 | 0.0300 | 0.1067 | 0.0599 |
| % Change day | +0.03% | -0.52% | +0.05% | +0.17% | +0.16% |
| % Change week | +0.03% | -0.52% | +0.05% | +0.17% | +0.16% |
| % Change month | +0.08% | -0.57% | -0.73% | -0.39% | +0.40% |
| % Change year | +1.36% | +3.17% | +8.37% | +3.14% | +12.19% |
| The Lifecycle (L) Funds | |||||
| Fund | L INC | L 2025 | L 2030 | L 2035 | L 2040 |
| Price | 23.6204 | 11.931 | 41.4679 | 12.3569 | 46.423 |
| $ Change | 0.0040 | 0.0029 | 0.0167 | 0.0050 | 0.0198 |
| % Change day | +0.02% | +0.02% | +0.04% | +0.04% | +0.04% |
| % Change week | +0.02% | +0.02% | +0.04% | +0.04% | +0.04% |
| % Change month | -0.04% | -0.09% | -0.18% | -0.20% | -0.23% |
| % Change year | +3.37% | +4.44% | +6.12% | +6.58% | +7.03% |
| Fund | L 2045 | L 2050 | L 2055 | L 2060 | L 2065 |
| Price | 12.6249 | 27.4902 | 13.3614 | 13.3601 | 13.3586 |
| $ Change | 0.0055 | 0.0134 | 0.0133 | 0.0132 | 0.0132 |
| % Change day | +0.04% | +0.05% | +0.10% | +0.10% | +0.10% |
| % Change week | +0.04% | +0.05% | +0.10% | +0.10% | +0.10% |
| % Change month | -0.25% | -0.26% | -0.29% | -0.29% | -0.29% |
| % Change year | +7.41% | +7.78% | +8.96% | +8.96% | +8.96% |


