Good Evening, Concern over the global economy resurfaced and the market gapped down in the morning session. The bulls tried to engineer another intraday reversal, but the going got to rough and they gave up before the bell leaving stocks deeply in the red.
The days selling left with the following results. Our TSP allotment had a rough day dropping -1.60%. That’s what small caps do when the market heads south…. For comparison, the Dow lost -0.78%, the Nasdaq -1.13%, and the S&P 500 -0.87%. Quite the opposite of yesterday.
The days action left us with the following signals: C-Neutral, S-Neutral, I-Neutral, F-Neutral. We are currently invested at 100/S. Our allotment is now +4.12% on the year not including the days results. Here are the latest posted results.
| 05/02/16 |
|
|
|
Prior Prices |
| Fund |
G Fund |
F Fund |
C Fund |
S Fund |
I Fund |
| Price |
15.0108 |
17.5192 |
28.2685 |
35.8864 |
24.1804 |
| $ Change |
0.0015 |
-0.0374 |
0.2193 |
0.2920 |
0.1782 |
| % Change day |
+0.01% |
-0.21% |
+0.78% |
+0.82% |
+0.74% |
| % Change week |
+0.01% |
-0.21% |
+0.78% |
+0.82% |
+0.74% |
| % Change month |
+0.01% |
-0.21% |
+0.78% |
+0.82% |
+0.74% |
| % Change year |
+0.64% |
+3.33% |
+2.56% |
+1.85% |
+0.35% |
| |
L INC |
L 2020 |
L 2030 |
L 2040 |
L 2050 |
| Price |
17.9711 |
23.533 |
25.4723 |
27.0305 |
15.2903 |
| $ Change |
0.0266 |
0.0809 |
0.1231 |
0.1521 |
0.0984 |
| % Change day |
+0.15% |
+0.34% |
+0.49% |
+0.57% |
+0.65% |
| % Change week |
+0.15% |
+0.34% |
+0.49% |
+0.57% |
+0.65% |
| % Change month |
+0.15% |
+0.34% |
+0.49% |
+0.57% |
+0.65% |
| % Change year |
+1.11% |
+1.40% |
+1.63% |
+1.73% |
+1.76% |
Now lets take a look at the charts. All signals are annotated with green circles. If you click on the charts they will become larger.
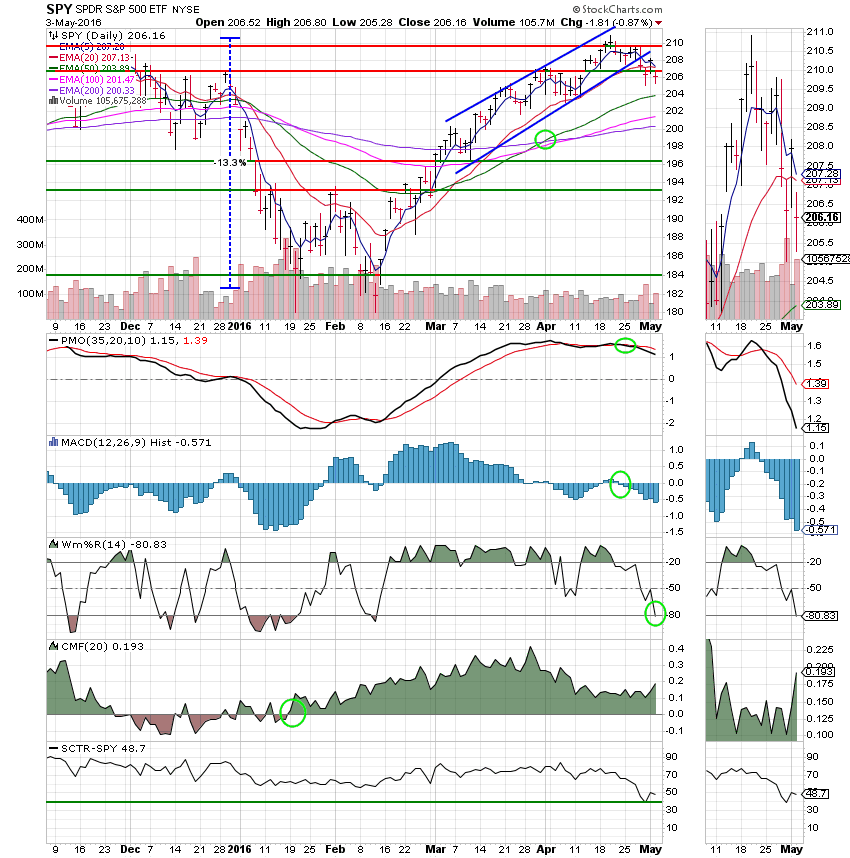
C Fund: The C Fund continued to deteriorate as did all the other TSP equity based charts. The Williams%R moved into a negative configuration today. However, It should be noted that this is an oversold/ overbought indicator which is now signaling oversold. While the overall chart is stressed, there are a few reasons not to give up just yet. #1 Most of the time the Wms%R does not stay in a negative configuration long. If you will look at February 10th you will see a classic example of how a move by this indicator into negative territory often develops into a new uptrend. #2 The CMF remains in positive territory indicating that money is still flowing into this fund. Put #1 and #2 together and conditions exist for the current short term trend to reverse. As long as the 5 EMA remains above the 50 EMA we will give equites a chance.
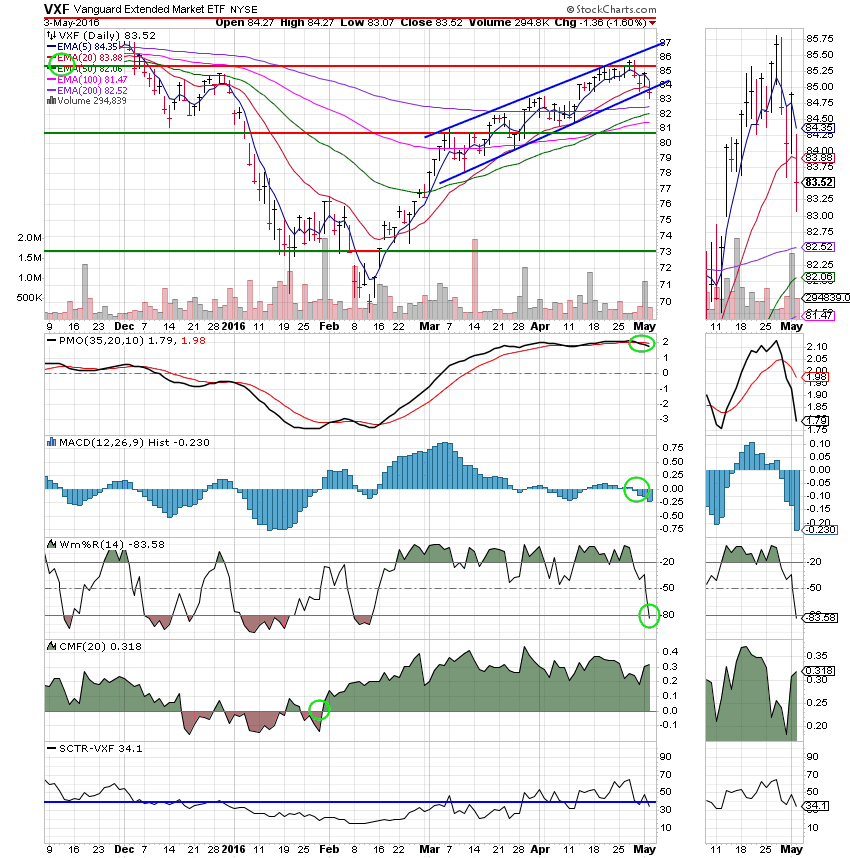
S Fund: Ditto the analysis of the C Fund. This one is almost identical. One notable exception is that the CMF is much stronger indicating that a lot of money is still moving into speculative small caps and midcaps. More than is moving into large caps. If a reversal of this short term trend occurs, this fund has the fuel to move higher faster. Again, we will give this fund a chance to work as long as the 5 EMA remains above the 50 EMA.
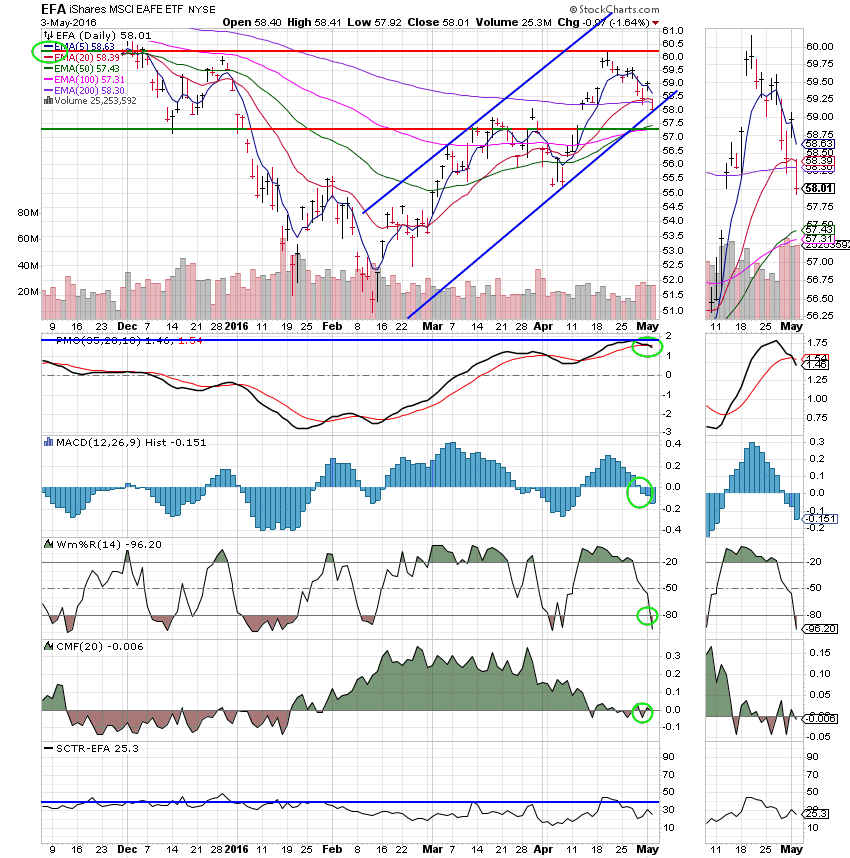
I Fund: Price still remains within it’s upward ascending channel. Otherwise this fund remains the weakest of our equity based funds as evidenced by the lowest SCTR of the bunch at 25.3. We will watch carefully to see if the lower trend line holds…..
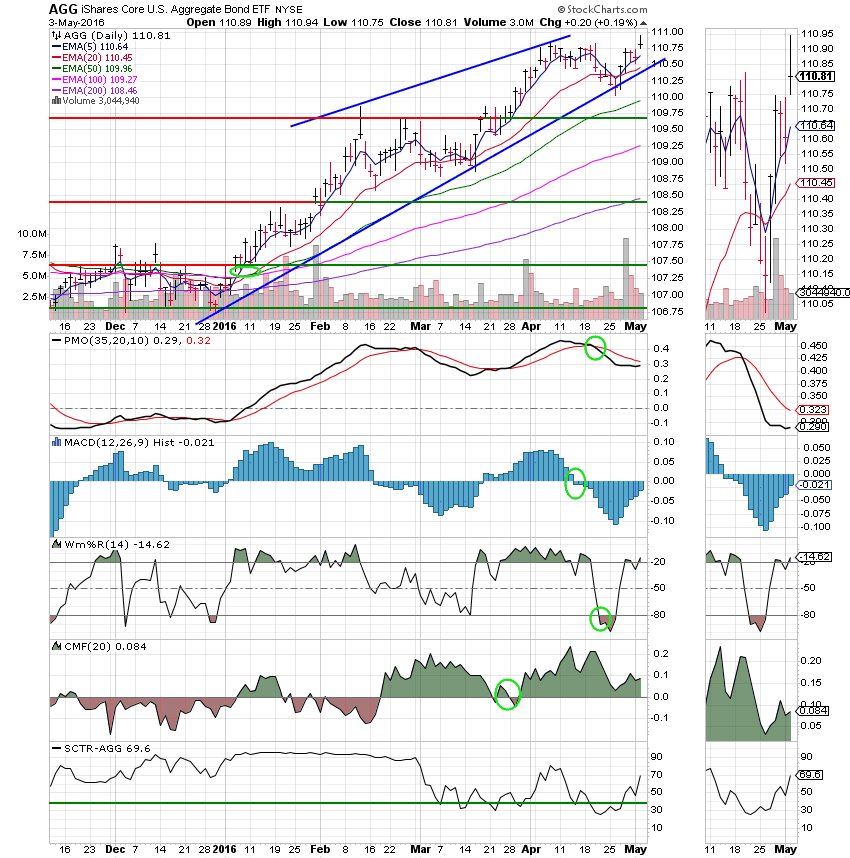
F Fund: No surprise here that the price came back to life and posted a gain of +0.19%. That is the reason that this fund maintained a neutral signal and did not move to a sell. Neutral means that the chart can move either way at that point and that the existing trend (Whichever direction was going) is still intact but is only at a higher risk of reversing. A big hint on a chart that is moving up such as this one is the lower trend line which in this case has been tested but never violated. The trend is still up in this fund. The SCTR moved back up to 69.6 showing the F Funds newfound strength.
No doubt about it, equities have come under some stress in the last week. However, being under stress does not mean that they’ve changed directions. Using our current set of indicators, the 5 EMA must pass through the 50 EMA with at least three of the other indicators in negative configurations to generate a sell signal. When and if that occurs in the S Fund we will adjust our allocation. If not, we will stick to our guns. In most cases, it is discipline that wins in this game. That’s all for tonight. Have a great evening!
God bless, Scott 
***Just a reminder that you can review the performance of our allocation at the Web Site TSPTALK.com in the autotracker section under the screen name KyFan1.
I produce and publish this blog as both a ministry and for the benefit of any Federal Government Employee. This is done to offer you some guidance as to how to approach your retirement more financially successful. When it is time for you to retire, I recommend you utilize the services of a Professional Money Manager, who works with a reputable investment firm. He understands the guidance you have already received and he can manage your savings assets utilizing a more advanced investment program into the future.
If you would like to receive more information about this introduction, please feel free to contact me at KyFan1@aol.com.