
Good Evening, This is one hard market to trade. Today instead of heading either up or down most of the day it started higher before dropping. At that time it bottomed and turned back up into the close. While stocks didn’t finish at their highs for the day, the U shaped action was enough to frustrate the bulls and bears alike. The headlines say the market was stronger on oil and then weaker on Apple. Go figure……
The days trading left us with the following results: Our TSP allotment dropped -0.41%. For comparison the Dow added +0.05%, the Nasdaq lost -0.49%, and the S&P 500 slipped back -0.02%. We fared somewhat better than the Nasdaq but lagged behind the Dow and the S&P as small caps were hammered.
Wall Street mixed as Apple tumbles to two-year low
The days action left us with the following signals: C-Neutral, S-Neutral, I-Neutral, F-Buy. We are currently invested at 100/S. Our allocation is now +2.11% on the year not including the days results. Here are the latest posted results:
| 05/11/16 | Prior Prices | ||||
| Fund | G Fund | F Fund | C Fund | S Fund | I Fund |
| Price | 15.0171 | 17.6272 | 28.071 | 35.1956 | 23.7794 |
| $ Change | 0.0007 | 0.0205 | -0.2560 | -0.3788 | 0.0073 |
| % Change day | +0.00% | +0.12% | -0.90% | -1.06% | +0.03% |
| % Change week | +0.02% | +0.23% | +0.41% | +0.21% | +1.03% |
| % Change month | +0.05% | +0.40% | +0.08% | -1.12% | -0.93% |
| % Change year | +0.68% | +3.97% | +1.85% | -0.11% | -1.31% |
| L INC | L 2020 | L 2030 | L 2040 | L 2050 | |
| Price | 17.9419 | 23.4212 | 25.2929 | 26.8033 | 15.1399 |
| $ Change | -0.0216 | -0.0676 | -0.1038 | -0.1286 | -0.0831 |
| % Change day | -0.12% | -0.29% | -0.41% | -0.48% | -0.55% |
| % Change week | +0.14% | +0.28% | +0.38% | +0.43% | +0.48% |
| % Change month | -0.01% | -0.13% | -0.22% | -0.28% | -0.34% |
| % Change year | +0.95% | +0.92% | +0.92% | +0.87% | +0.76% |
Now lets take a look at the charts. All signals are annotated with green circles. If you click on the charts they will become larger.
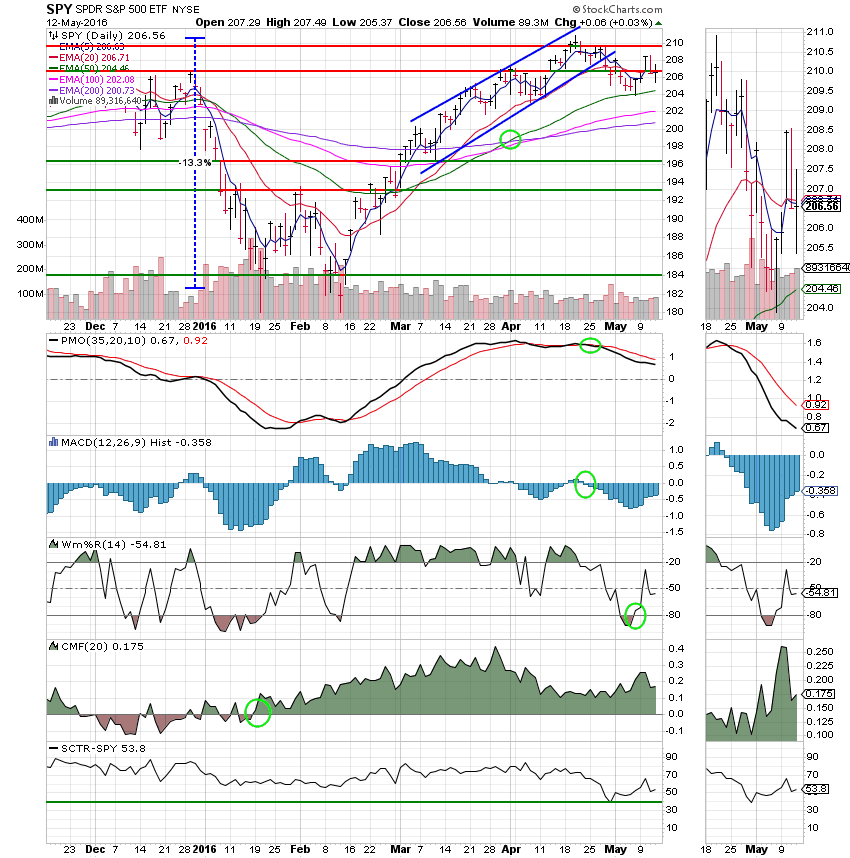
C Fund: Price is currently fighting resistance as just below 207.
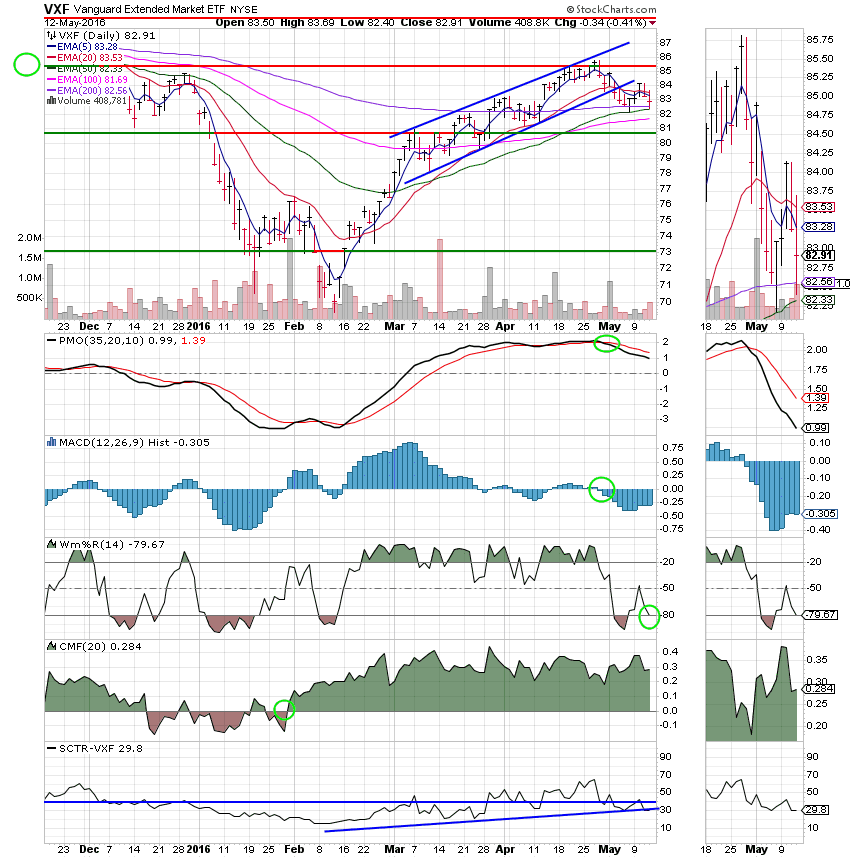
S Fund: Price is currently stuck in a trading range between 80.50 and 85.50. The 50 EMA is currently acting as support. Should this support break we will be forced to bail out of the S Fund. Unfortunately, the S Fund made up of a large portion of small caps has been out performed by the C Fund in recent sessions as money has rotated out of riskier small caps into more stable large caps (i.e. the C Fund). The S Funds SCTR of 29.8 vs the C Funds 53.8 tells us all we need to know. So why not move back to the C Fund?? Right now we are betting that the market will head back up. If that’s the case, money will move back into small caps and fuel the S Fund to out perform. Please note the trend line I have drawn in the SCTR. If it holds then the S Fund will indeed move higher and if it moves higher it will do so at a more rapid rate than the C Fund. All that said, the two things we are watching on this chart are support at the 50 EMA and the lower trend line in the SCTR. If those hold we will be in good shape. If not, we’ll be forced to reallocate our cash. If we moved to the C Fund right now, we could find ourselves in the wrong place if the short term situation changed which has been something that has taken place several times in the past six months. That is what has made this market so difficult to trade in 2016!!
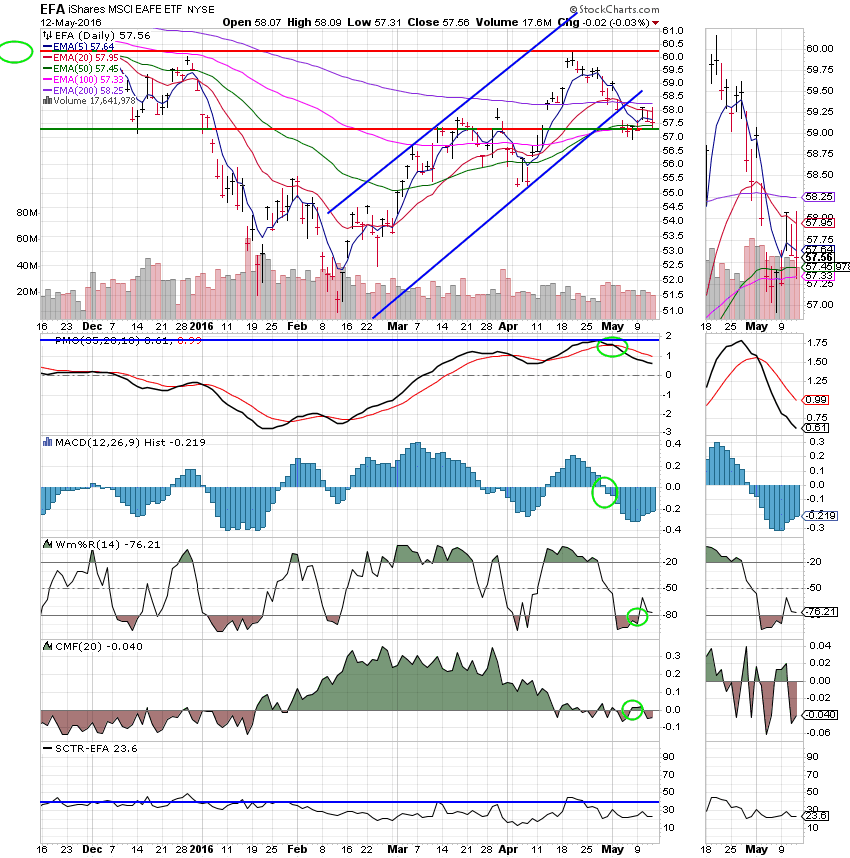
I Fund: Support is holding at 57.25. Keep your eye on this level.
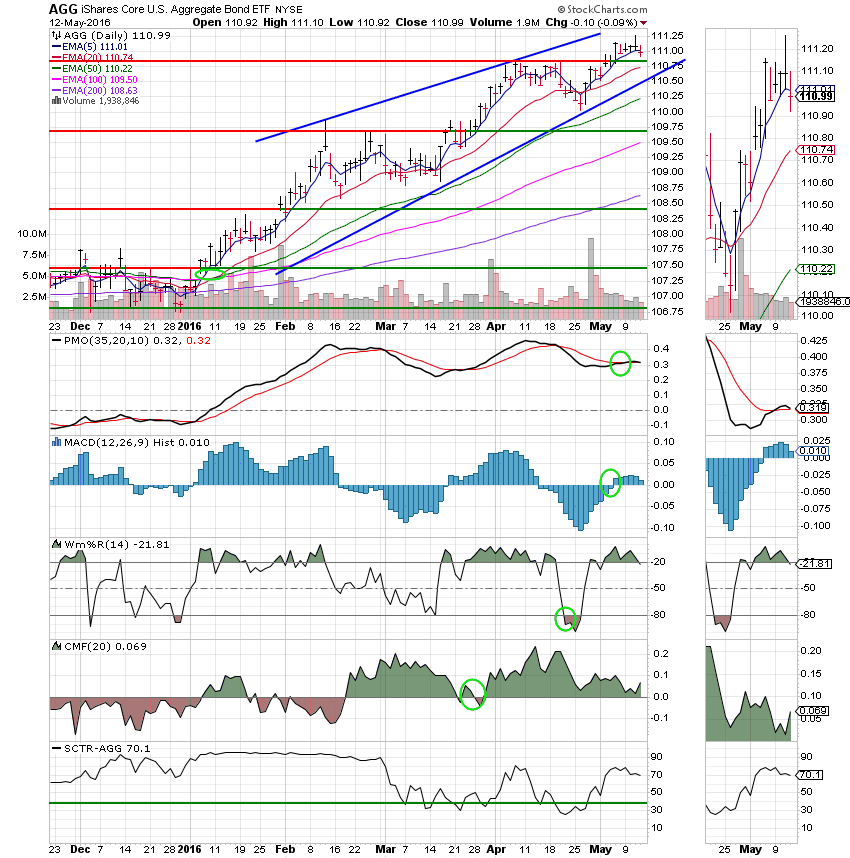
F Fund: Our signals have been rock solid on this one. Price continues to trade within the ascending wedge. As long as the lower trend line holds, the F fund will be a steady place to be.
Nothing else to add here. Either small caps will turn around or they will not. That will determine what our next move is. I will say it again. This is a difficult market to trade. Have a nice evening!