
Good Evening,
As some of you know, my main hobby when I’m not working is cars. I’m a car guy! So tonight I’m going to use a car analogy to describe this market. It’s the best one that I know to use so I apologize to those of you who don’t see the picture that I’m trying to paint. In high performance cars we use what is called a rev limiter to keep from running an engine at too many RPM’s and damaging it or in car guy terms blowing it. It is an electronic nanny that basically shuts the engine off when it reaches a preset RPM. When this takes place, there’s usually a small jerk as the engine cuts off to avoid damaging itself and then restarts at a slightly lower RPM. In further car talk, this is called bumping off the Rev Limiter. No matter how hard you try, you can’t get that engine to run faster than the RPM set in the Rev Limiter
. So Scott, where are you going with this?
The market has been in a tight trading range since February. That was really the last real move that this market made. Since then it’s been trading in the same range. There’s too much support for it to go down and not enough buyers to make it go up. Each time the market hits overhead resistance it is turned back. This market is just like an engine bumping off its Rev Limiter. Each time it reaches the preset level, it cuts off and starts over again. The market just doesn’t trade like it use to. There is no real fear of a correction.
Corrections simply don’t occur the way that they used to. Now, it’s more of a rotation from sector to sector rather than lock and step selling. It’s what some traders refer to as stealth correction. You can call it whatever you want, but the market never really drops and it’s hard to short a market that never drops. We used to make money by selling or shorting a dropping market and then getting back in for the next run at a cheaper price. There’s none of that now with all the Central Bank and computer manipulation. So where’s all this going? It’s hard to say. All we can do is shift smooth and try as hard as we can not to bump off the Rev Limiter…
The market headed up in the morning and then finished flat in the afternoon. Neither the buyers or the sellers could make any progress. It seems like they are all waiting on the sidelines for the next market moving event.
The day’s action left us with the following results: Our TSP allotment out performed closing up +0.466% on the day thanks to another strong day for the I Fund. For comparison, the Dow slipped back -0.04%, the Nasdaq added +0.11%, and the S&P 500 was off -0.04%. I thank God that our allotment had another great day!
Wall St. little changed in earnings, data lull
The day’s action left us with the following signals: C-Neutral, S-Neutral, I-Neutral, F-Sell. We are currently invested at 23/C, 14/S, 63/I. Our allocation is now +4.65% on the year not including the day’s gains. Here are the latest posted results:
| 05/12/15 | |||||
| Fund | G Fund | F Fund | C Fund | S Fund | I Fund |
| Price | 14.7167 | 16.8756 | 27.9018 | 37.9787 | 26.7564 |
| $ Change | 0.0008 | 0.0088 | -0.0806 | -0.0667 | -0.0384 |
| % Change day | +0.01% | +0.05% | -0.29% | -0.18% | -0.14% |
| % Change week | +0.02% | -0.50% | -0.78% | -0.25% | -0.17% |
| % Change month | +0.07% | -0.94% | +0.75% | +0.80% | +0.39% |
| % Change year | +0.69% | +0.44% | +2.71% | +4.63% | +10.48% |
| L INC | L 2020 | L 2030 | L 2040 | L 2050 | |
| Price | 17.7196 | 23.5971 | 25.731 | 27.4767 | 15.6623 |
| $ Change | -0.0070 | -0.0257 | -0.0365 | -0.0450 | -0.0291 |
| % Change day | -0.04% | -0.11% | -0.14% | -0.16% | -0.19% |
| % Change week | -0.12% | -0.28% | -0.35% | -0.40% | -0.43% |
| % Change month | +0.13% | +0.31% | +0.39% | +0.46% | +0.52% |
| % Change year | +1.54% | +3.05% | +3.73% | +4.16% | +4.70% |
Let’s take a look at the charts:
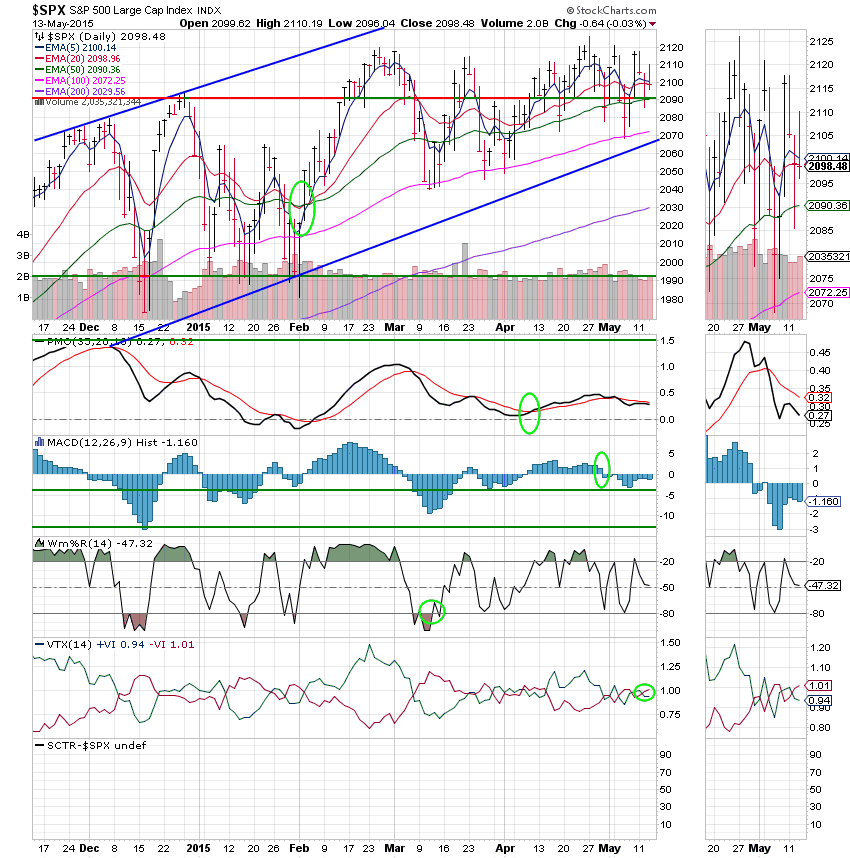
C Fund: Price closed slightly below its 20 EMA today, but still well above its 50 EMA. The remainder of the indicators reflect the flat action with no real change.
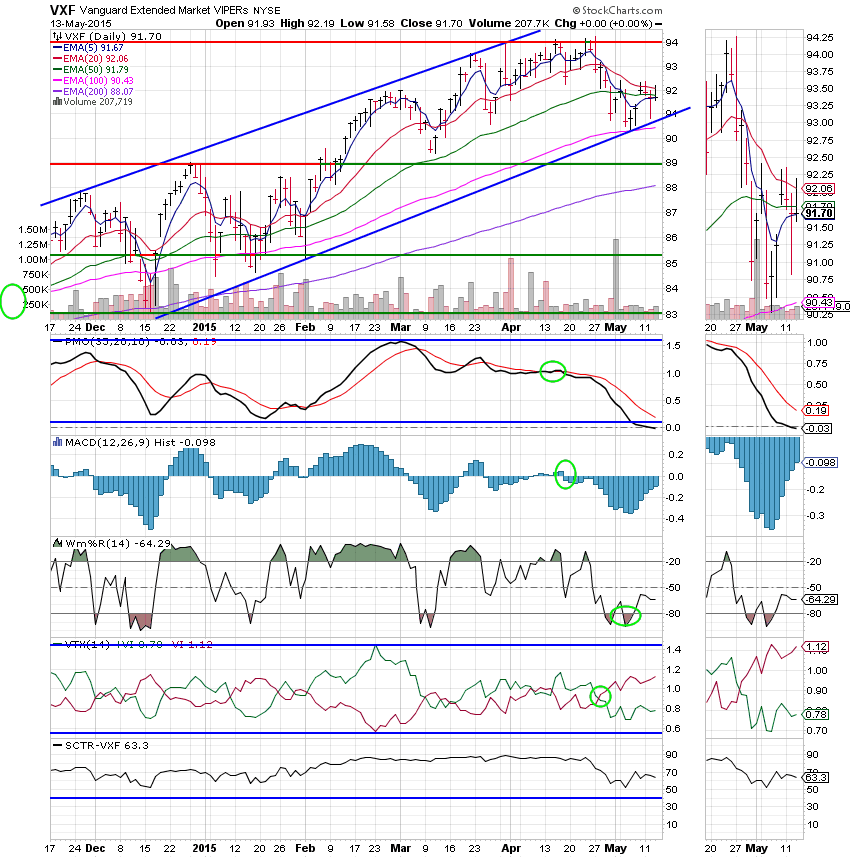
S Fund: Price was flat again, closing under its 20 EMA. The 20 EMA moved slightly closer to the 50 EMA, but is not threatening a negative crossover just yet. The remainder of our indicators reflected the flat action.
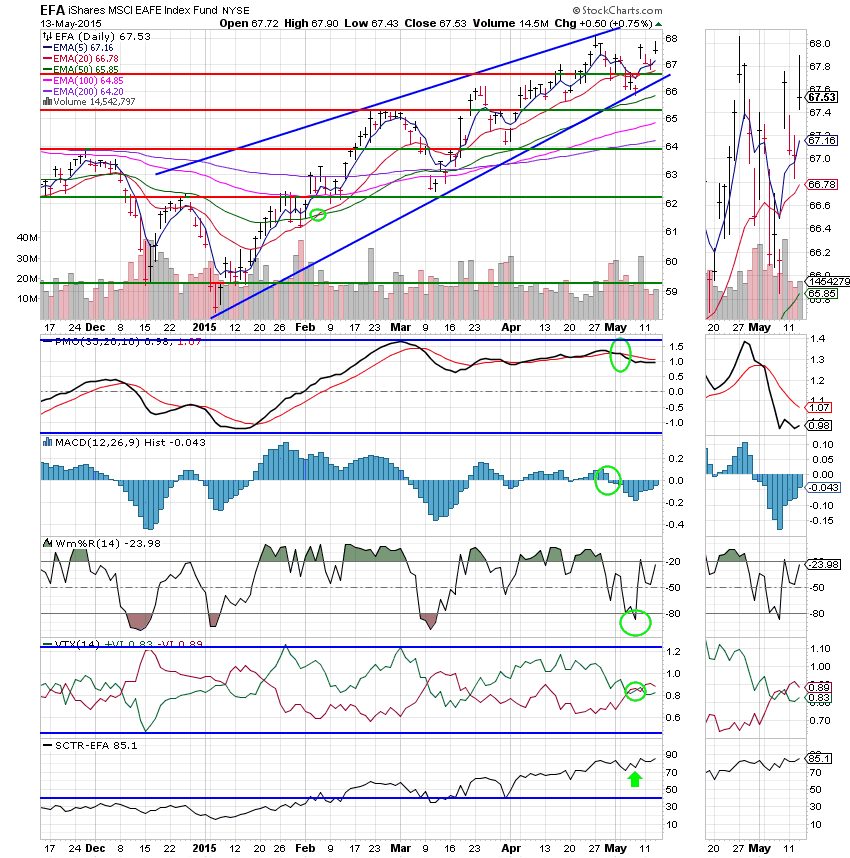
I Fund: The I Fund saved the day again today with another solid gain aided by a cheaper dollar and a good economic report in Europe. Price is now in the middle of the ascending wedge. All indicators are improving with the SCTR now at a very strong 85.1. However, the chart remains at neutral with the PMO, MAC D, and VTX still in negative configurations. Yes, I’m still bullish on the I Fund!
F Fund: Price was flat as the Fund continues in its downtrend. I wouldn’t even consider buying a fund or a stock with an SCTR of 23.8! I need to redraw the trend line to accommodate the down trend……

Sooner or later the current tight trading range will be resolved, so we’ll have to keep an eye on the charts to see which way goes. I wouldn’t even venture a guess as to which way that will be. I’m just depending on my Heavenly Father to guide me as He has always done. Give Him all the Praise! May He continue to bless your trades! Have a nice evening.
God bless,
Scott![]()