Good Evening, The market again finds itself in familiar territory as it laments over a possible Fed rate hike. This has been going on for a while now. The cycle goes like this, Several Fed members make Hawkish remarks about a possible rate increase after a jobs report or similar news. The market has a negative reaction and the Fed distances itself from a rate hike. The market spikes and then trades sideways. Then the Fed meets and holds rates steady and the market spikes again only to lose all it’s gains when a Fed member or members starts to talk about a rate hike again. When will this cycle end? When conditions actually get good enough to support a rate hike which in my opinion they are not at this time or when the Fed is naïve enough to increase interest rates in a weak economy. Of course the latter scenario would likely lead to the bears long awaited selloff of 20% or more. However, until one of those two things happen we are caught in the endless loop which traps us inside this broad trading range. Absent of any catalysts to move the market one way or the other we will be lucky to finish 2016 with a return in the 1-5% range. Unless your day trading there just simply is not a lot of money to be made here.
The days trading left us with the following results: Our TSP allotment gave up another -0.55%. for comparison, the Dow lost -0.52%, the Nasdaq -0.56%, and the S&P 500 -0.37%.
Stocks Fall Over Continued Worry About Possible Fed Hike
The days trading left us with the following signals: C-Neutral, S-Neutral, I-Sell, F-Neutral. We are currently invested at 100/S. Our allocation is now +1.15% on the year not including the days results. Here are the latest posted results:
| 05/18/16 | Prior Prices | ||||
| Fund | G Fund | F Fund | C Fund | S Fund | I Fund |
| Price | 15.0221 | 17.493 | 27.8627 | 34.8636 | 23.532 |
| $ Change | 0.0007 | -0.1003 | 0.0096 | 0.0427 | -0.0032 |
| % Change day | +0.00% | -0.57% | +0.03% | +0.12% | -0.01% |
| % Change week | +0.02% | -0.82% | +0.10% | +0.11% | +0.23% |
| % Change month | +0.09% | -0.36% | -0.66% | -2.05% | -1.96% |
| % Change year | +0.72% | +3.17% | +1.09% | -1.06% | -2.34% |
| L INC | L 2020 | L 2030 | L 2040 | L 2050 | |
| Price | 17.9071 | 23.323 | 25.145 | 26.6218 | 15.0258 |
| $ Change | -0.0044 | -0.0034 | -0.0023 | -0.0011 | 0.0016 |
| % Change day | -0.02% | -0.01% | -0.01% | +0.00% | +0.01% |
| % Change week | +0.00% | +0.03% | +0.05% | +0.07% | +0.09% |
| % Change month | -0.21% | -0.55% | -0.81% | -0.95% | -1.09% |
| % Change year | +0.75% | +0.49% | +0.33% | +0.19% | +0.00% |
Now lets take a look at the charts. All signals are annotated with green circles. If you click on the charts they will become larger.
C Fund: Price closed under it’s 50 EMA. This chart is definitely showing signs of stress. The only positive thing I can say about this chart right now is that the CMF turned up slightly today indicating that the amount of money flowing into this fund increased. Other than that, this chart is on the verge of breaking down and moving to an overall sell signal.
S Fund: Price traded under it’s 50 EMA and is in danger of dragging it’s 5 EMA down through the 50. All other indicators are already in negative configurations. Barring a very strong day tomorrow, we will likely get a sell signal here and be forced to move our money.
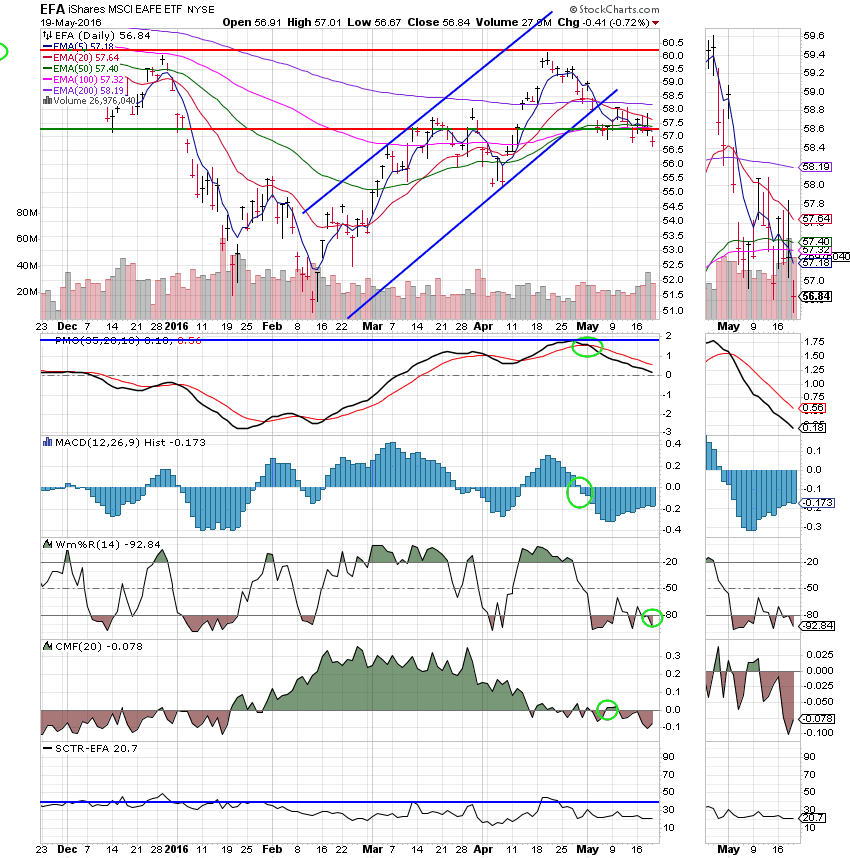
I Fund: The I Fund generated a sell signal when the Williams%R moved into a negative configuration. All indicators for the I fund have now turned negative. Topping off the sell signal is an SCTR of only 20. The I fund is the first of our equity based funds to roll over during the current sell off.
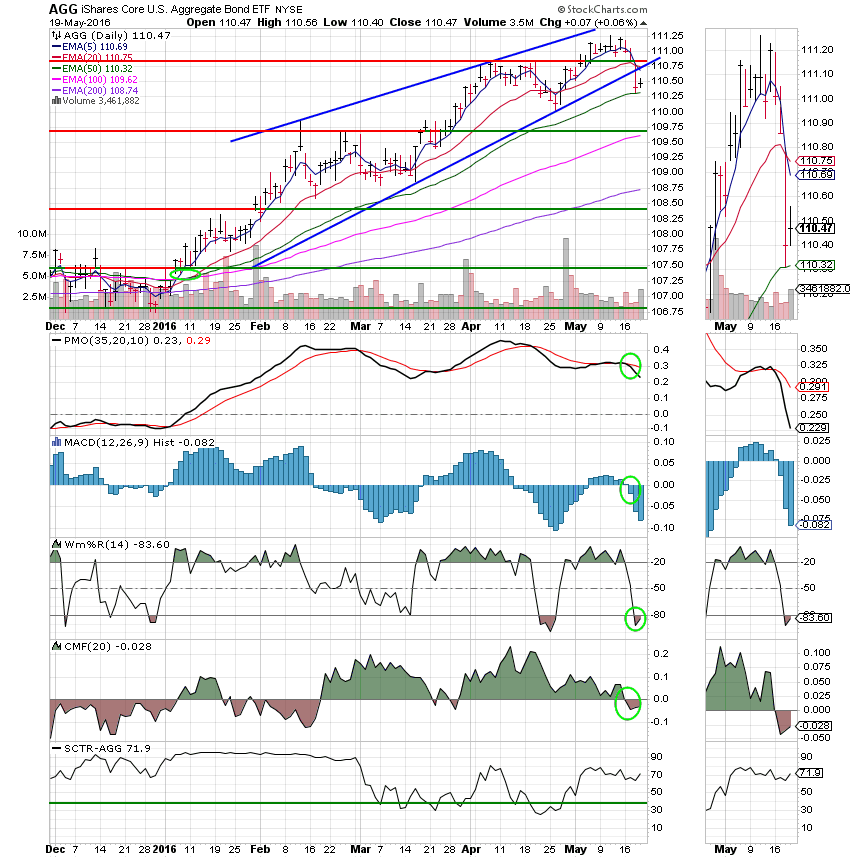
F Fund: No surprise here. The F Fund rebounded slightly after losing over 0.4% yesterday. This one is a weak Neutral with all indicators except price in negative configurations. That said, an SCTR of 71.9 is encouraging. Right now, bonds are trading off the Fed….
Unless we get a powerful bounce tomorrow, we will end up moving are money so stay vigilant for an alert. That’s all for today. Have a great evening and may God continue to bless your trades!


