Good Evening, I find this market to be complicated. If you are a new investor you will have to work overtime to understand the dynamics of the current market. I will explain it the simple way which means I’m leaving a lot of details out. On the surface the market appears to be undergoing a lot of sector rotation as investors appear to be undecided about which way they will go. However, it’s not that they’re undecided but more like their reacting to changing conditions. The question is what conditions?? That’s what I am going to explain the simple way…. In recent blogs we have discussed that the market is guided by Fed policy regarding economic stimulus or to be more specific how they will ultimately end the stimulus. Also, we talked about the Fed’s mandate to control inflation which they like to stay around two percent. Here’s my stab at a very simplified explanation of what is driving the current market. Interest rates are tied to bond yields. Bond yields are tied to bond prices. Bond prices are tied to demand for bonds in the bond market. Inflation is tied to economic demand. Economic demand is tied to the money supply which is in turn tied to interest rates and employment. Interest rates are tied to the Fed and Fed policy is tied to inflation and employment. Employment is tied to economic stimulus which is Fed policy. Inflation is tied to interest rates which is also Fed Policy. Higher inflation is tied to increased interest rates. Economic stimulus which includes 4 billion in monthly bond purchases as well as artificially low interest rates leads higher inflation which again in turn leads to higher interest rates resulting from the Fed increasing rates to control the higher inflation…that also leads to the Fed reducing the economic stimulus that has helped the economy restart but has also led to higher inflation which led to higher interest rates. which again is tied to higher bond yields which in turn was was caused by lower bond prices which was a result of lower demand which will tied to the the Fed tapering bond purchases which was a result of the improving economy which was a result of the Feds economic stimulus which is no longer needed…. Confused…. that’s the purpose of this exercise. Everything is in some way related to everything else!! So how do we know where we’re heading?? Keep your eye on the bond yields. They are the one central component of this whole thing that from watching you can determine the direction in which the market is likely to go. Higher bond yields mean higher interest rates which leads to a tighter money supply which leads to a lower tech sector…. or…… to a greater emphasis on value plays such as gold. In the end the higher interest rates that result from the overheated economy become a drag on the market. It’s simple and we could have said it without all the aforementioned hullaballoo. Higher interest rates lead to a tighter money supply. That means there is less money to flow into the market which means the market will go down which in turn means the C and the S and the I funds will go down. AND….what is the canary in the coal mine??? Bond yields!! Watch the Bond yields on 1-3 year bonds, 10 year treasuries, and 20 year treasures. Also let me add one additional but separate tidbit of information. If you see the yield on the short term bonds become higher than that of the long term bonds sell and ask questions later. That is what leads to an inverted yield curve and if you can’t remember anything else about that just remember that it is very very bad….. and that’s yet another reason to watch bond yields. Oh yes, and one last thing. I promise this is the last one. Bond yields and bond prices move in opposite directions. So if you see bond yields trending down it is a good time to invest in the F Fund because it will move higher and now…..I’m really done… WATCH THE BOND YIELDS!!!!!!!!!!
The days trading left us with the following results: Our TSP allotment posted a gain of +0.64%. For comparison, the Dow added +0.20%, the Nasdaq +0.79%, and the S&P 500 +0.51%. Praise God for a day in the green!
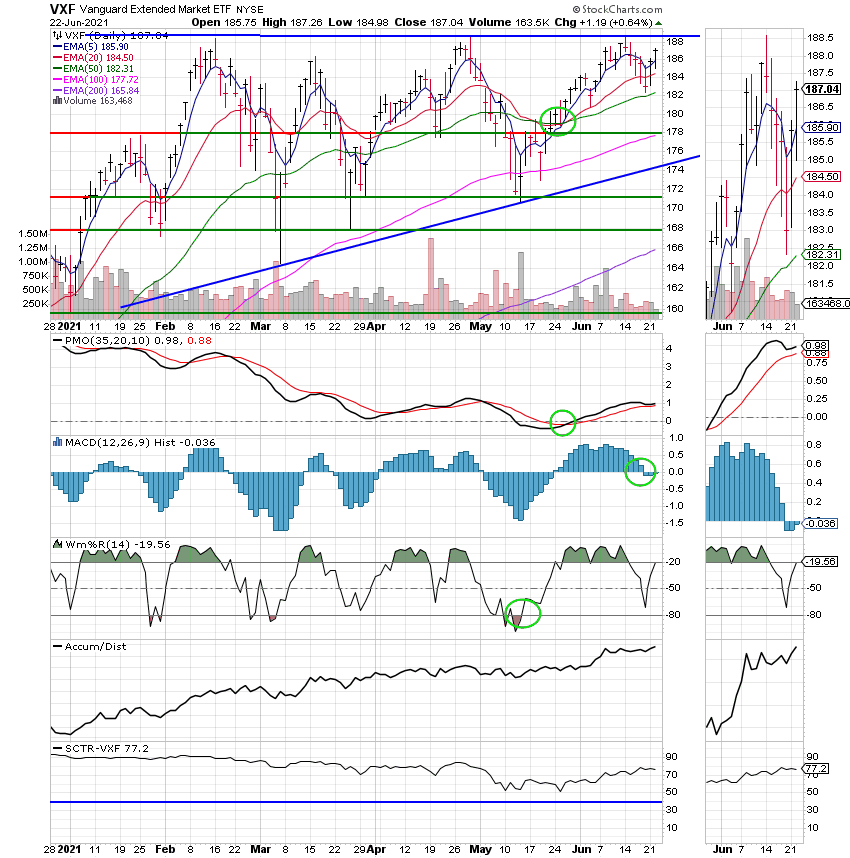
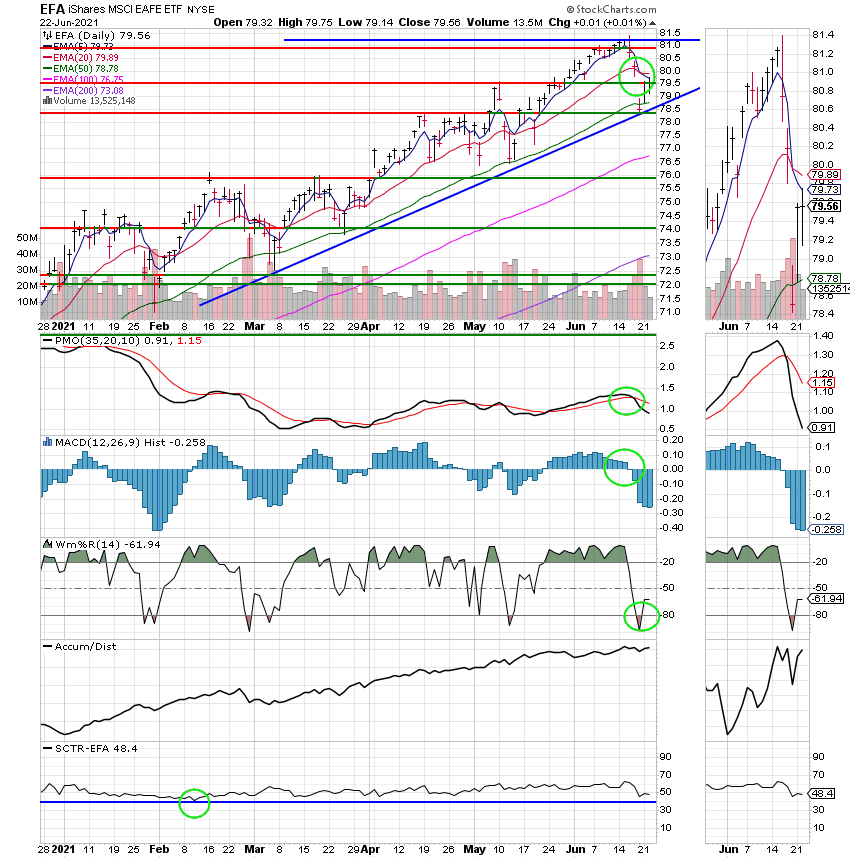
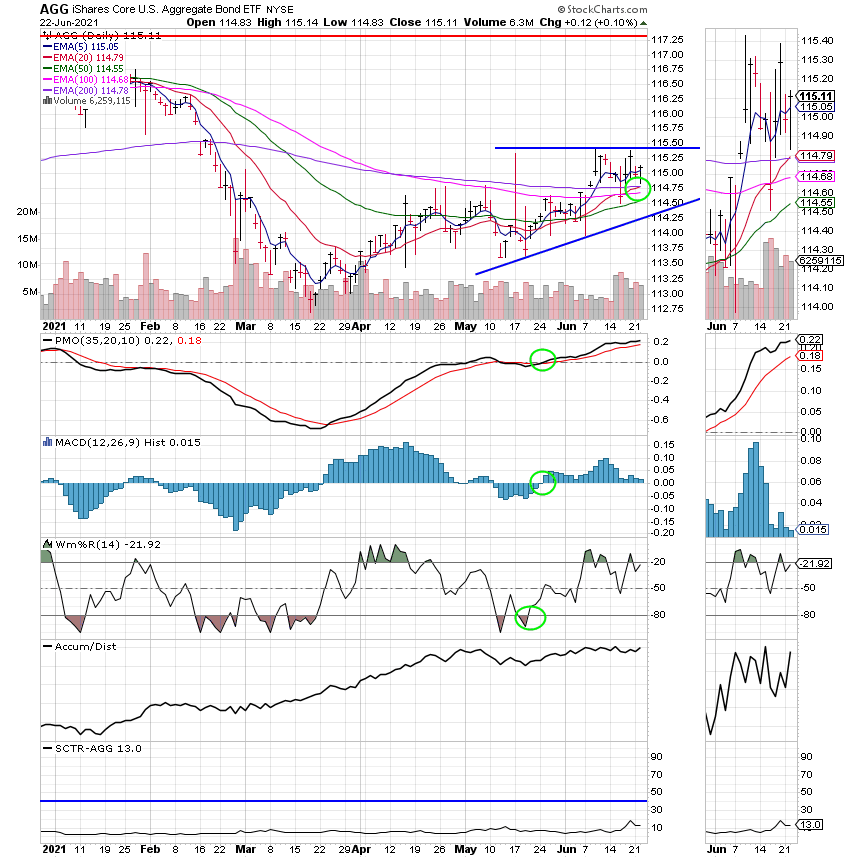
The days action left us with the following signals: C-buy, S-Buy, I-Hold, F-Hold. We are currently invested at 100/S. Our allocation is now +13.38% for the year not including the days results. Here are the latest posted results:
| 06/21/21 | Prior Prices | ||||
| Fund | G Fund | F Fund | C Fund | S Fund | I Fund |
| Price | 16.6093 | 20.8208 | 63.328 | 84.1304 | 38.923 |
| $ Change | 0.0020 | -0.0600 | 0.8773 | 1.2488 | 0.3250 |
| % Change day | +0.01% | -0.29% | +1.40% | +1.51% | +0.84% |
| % Change week | +0.01% | -0.29% | +1.40% | +1.51% | +0.84% |
| % Change month | +0.08% | +0.46% | +0.58% | +1.59% | -0.54% |
| % Change year | +0.61% | -1.77% | +13.26% | +13.38% | +9.99% |
| Fund | L INC | L 2025 | L 2030 | L 2035 | L 2040 |
| Price | 22.9561 | 11.8124 | 41.6256 | 12.4954 | 47.2641 |
| $ Change | 0.0611 | 0.0649 | 0.2955 | 0.0971 | 0.4002 |
| % Change day | +0.27% | +0.55% | +0.71% | +0.78% | +0.85% |
| % Change week | +0.27% | +0.55% | +0.71% | +0.78% | +0.85% |
| % Change month | +0.16% | +0.22% | +0.26% | +0.28% | +0.30% |
| % Change year | +3.05% | +5.85% | +7.35% | +8.01% | +8.68% |
| Fund | L 2045 | L 2050 | L 2055 | L 2060 | L 2065 |
| Price | 12.9446 | 28.3495 | 13.9116 | 13.9116 | 13.9115 |
| $ Change | 0.1172 | 0.2739 | 0.1663 | 0.1663 | 0.1663 |
| % Change day | +0.91% | +0.98% | +1.21% | +1.21% | +1.21% |
| % Change week | +0.91% | +0.98% | +1.21% | +1.21% | +1.21% |
| % Change month | +0.31% | +0.33% | +0.34% | +0.34% | +0.34% |
| % Change year | +9.26% | +9.85% | +12.08% | +12.08% | +12.08% |