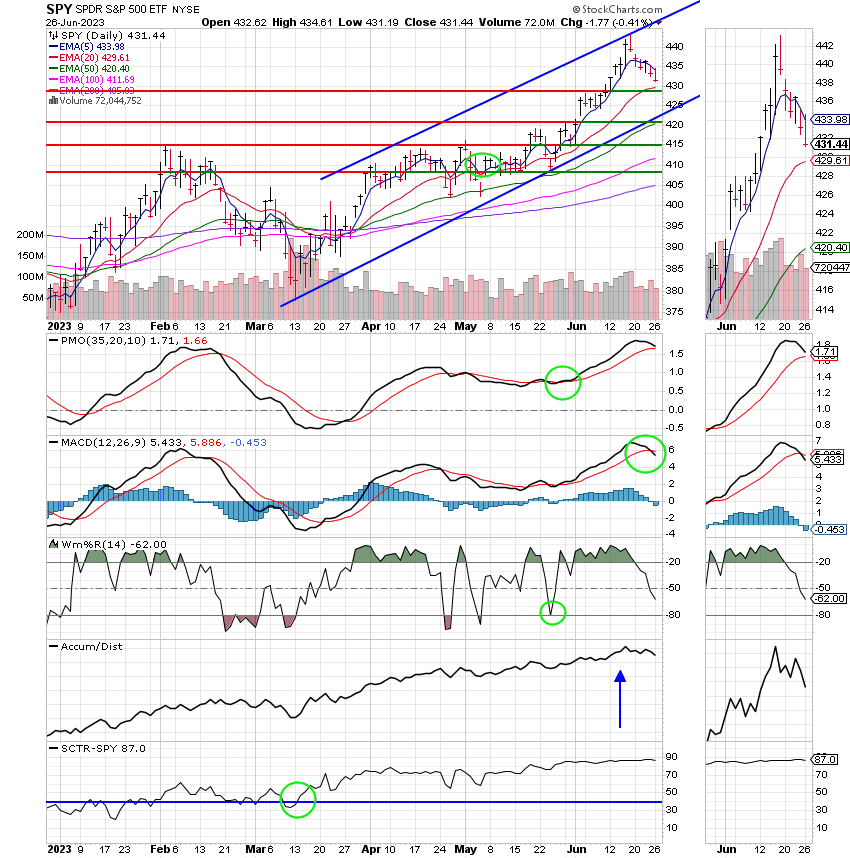
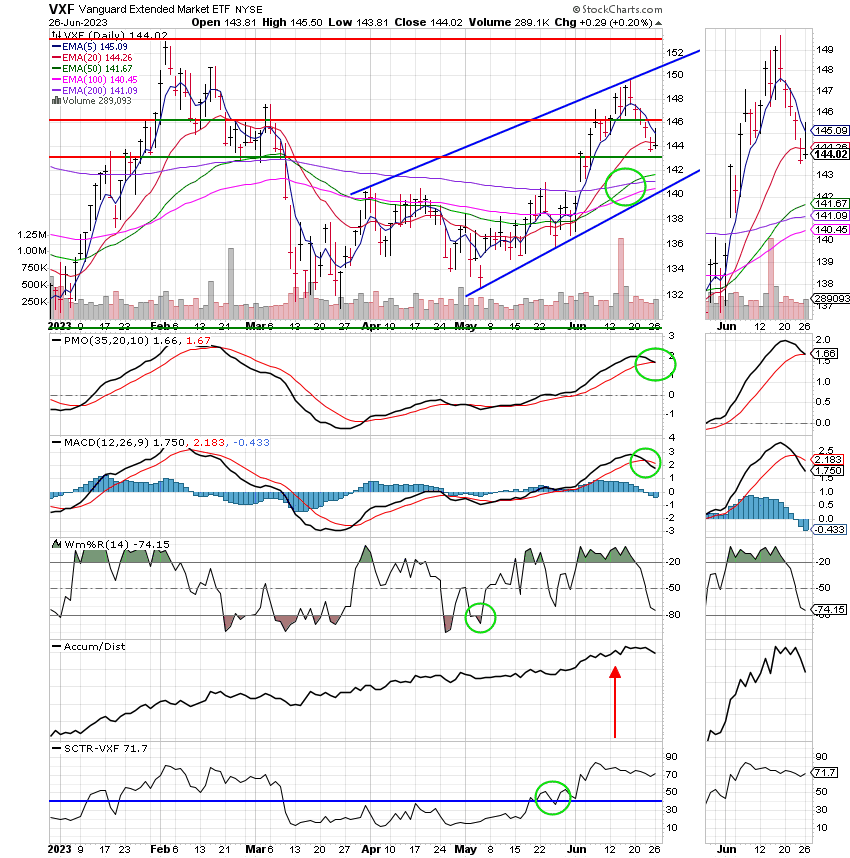
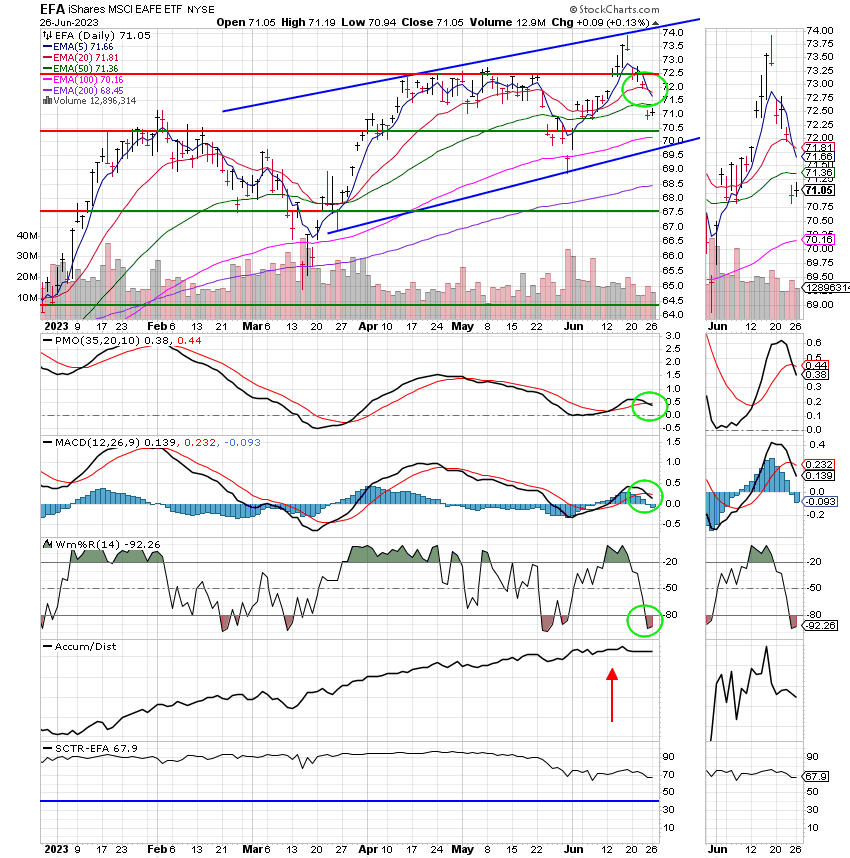
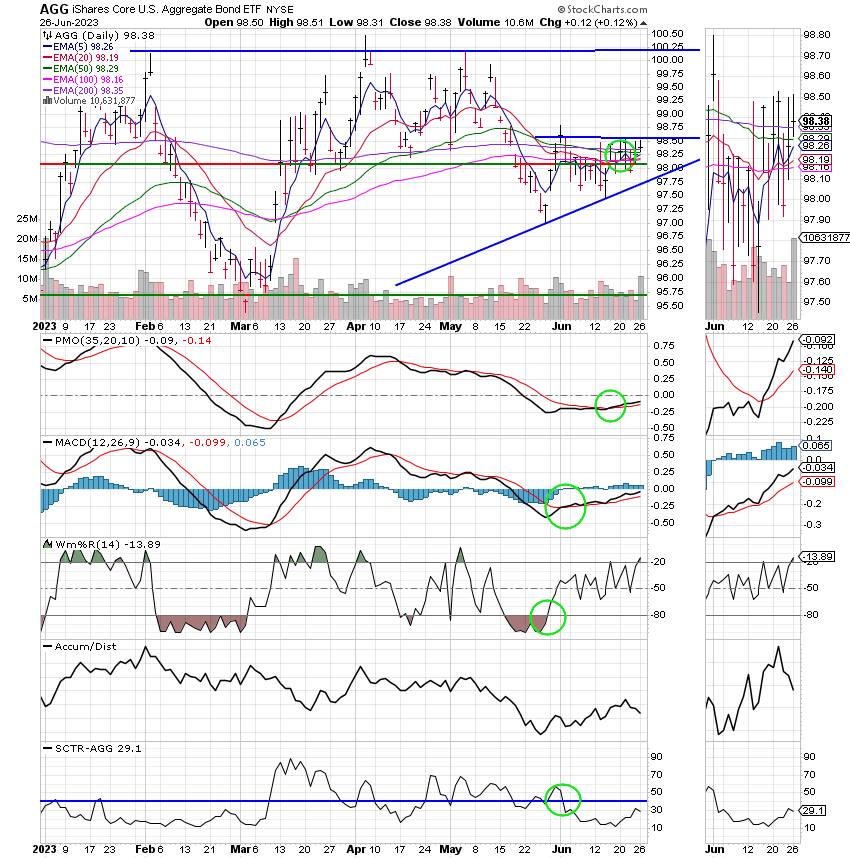
Good Evening, One thing about it. You’ll never get bored with this market. You may get frustrated or disappointed but definitely not bored. Last week the market succumbed to overbought conditions with a hefty bout of profit taking. While there’s no way to know for sure and you should always remain flexible, the charts tell us that this sell off may not be over. Most of our indicators where calling for a pullback and they were correct as the market sold off through Friday and continued to do so today (albeit in a moderate fashion). The main factor leading up to this weakness was that the recent rally left the market extremely overbought. The rally started shortly before the June Fed meeting and was fueled by the results of that meeting along with a few economic reports supporting the narrative that the Fed may be close to ending their policy of interest rate increases to control inflation. I will add that as strong as the rally was it could have been even stronger had the Fed not included in their post meeting statement that they planned to increase rates two more times in 2023. However, it should be noted that the Fed has been and continues to be data dependent. That is the reason the market was able to rally as much as it did after the negative Fed statement. If you read between the lines, market players don’t believe that the Fed will increase rates two additional times this year and most of them are betting against it. The bottom line is that fundamentally speaking this has been a hard market to read. On the other hand the charts have been a little clearer with the key word being “little”. While it is much easier to interpret the charts than it was throughout most of 2022 and the beginning of 2023, it is still a difficult market to navigate. This is in a large part due to the somewhat persistent inflation. It has always been my contention that this market will remain unstable until the rate of inflation returns to the Fed target of 2%. A couple of things to remember. Pullbacks are a healthy part of an up-trending market. So there no reason to panic. I do not believe this is a major selloff. At the worst I think it will end up being in the -5 to 10 percent range. I doubt if it will be a full correction. The charts have solid support way before things reach that point. Although, I am seeing some sector rotation. Investors are selling the tech stocks that led the market higher most of this year. That is the reason for most of the weakness you have seen the past week or so in the S Fund. The S Fund will likely remain volatile until this situation resolves itself. The C Fund will probably be the best bet to make and hang onto some profit in the short to intermediate run given it’s relatively high SCTR score of 87.3. I know most of you favor the S Fund in a bull market. The small and midcaps it contains make sizeable gains when the market it rising. No doubt about that. It is like taking a quick elevator to the penthouse. That is, when the market is rising, but when the market falls as it did last week being invested in the S Fund is like jumping out of the window to get back to the first floor. It’s quick and painful!! Can we tell that by looking at the charts?? We most certainly can. Remember that I mentioned the SCTR score for the C fund was 87.3? Well the SCTR for the S Fund is 71.7. A full 16 percentage points below the S Fund. Okay Scott that’s nice but what is the SCTR? Glad you asked. SCTR stand for Stock Charts Technical Rating. It a score that is derived by combining all the indicators at Stockcharts.com. The score runs from 0-100. Just like a test score in school. With 100% being the best score you can get and 0 being the worst. What the SCTR does is take all the indicators for a stock or fund and compare that stock or fund to all the other stocks or funds in it’s “universe”. In simple terms the C Fund is performing better than 87.3 % of the ETF’s in it’s universe while the S Fund is performing at a less but acceptable clip of 71.7. Using this system I give the stocks a grade just like you would get on a test. The C Fund currently has a grade of B+ when compared to the scores of it’s peers and the S Fund has a grade of C-. The C Fund is clearly performing at a higher level than the S fund. One caveat with this rating is that you need to look at the the individual chart itself to determine if that performance will continue. Yes, the C Fund has a B+ now and will probably continue to perform at a high level, but a glance at the individual chart is advisable because it may alert you to any possible pitfalls in the future. For instance, are the other indicators weakening or do they have some room to run higher? Are shares of the stock trending toward being accumulated or being distributed (which is to say sold)? You look at things such as that which might tell you if the stock could stop performing as well as it’s current rating. I normally favor the fund with the highest SCTR if none of those negative factors exist. So Scott, why aren’t you in the C Fund now? Glad you asked. There are a couple of things that tell me that the C Fund might pullback and I would much prefer to buy in without taking a loss as soon as I buy the shares. Currently the chart for the C Fund gives us a few tips that it might pull back. The PMO and MACD are both moving lower. Also, price is in a ascending channel and recently bounced off the upper trend line of that channel. Given the the fact that the MACD is in a negative configuration, price will likely descend to support at the lower trend line which I project to be in the 425 t0 430 range for the SPY. All things considered, the C Fund is still the best fund out of our equity based funds at this time. It’s just taking a little rest before it moves higher. So where does that leave us now?? Last week we where invested in the I Fund which had two incredibly bad days due to the rapidly changing market conditions. This generated a sell signal and given that signal we needed to move. A review of our equity based funds showed that they were all due for a pullback and the last thing we wanted to do was enter a trade and lose 5% or so right off the bat. So we hit the charts again and observed that treasury yields were rising. The thing you must understand about Bonds is that their yields and prices move in opposite directions. So falling yields equal rising prices. A quick glance at the chart for the F fund verified what we were seeing. It was moving higher and the chart looked as if it had some room to continue. So we decided to move to the F Fund and hopefully catch a short run higher while waiting for the C Fund to reset. It was also in the back of our mind that we would be protected in the event that the sell off becomes worse than anticipated and these days you just never know. I had a few questions about how we performed on the last trade. I honestly can’t say unless I take the time to go back and calculate it. Off the top of my head, I would say that we broke even or a little worse. I would like to point out that we keep a running total of our allocation year to date. Although, I could calculate each trade that is not what I focus on. Let me explain. While I would like to make money on each trade that is not always going to happen. My focus is on the YTD performance of our allocation. There may be an instance where the market falls and all the funds drop as they did last week, but rapidly changing market conditions make another fund more attractive than the one I am in. Should, I hold the fund I have and underperform just because I am down on the trade or should I move to a better performing fund that will allow me to make or save more money? My goal is always to be in the best place that I can as much as I possibly can. Over the years that has worked out best for me in the long run as many of you know. We keep working until we get a good long run and that’s where we’ve made our money throughout the years. Also, as I talked about in a few of our recent blogs, I am aware that our performance was not good for the the 15 month period that included 2022 through the end of the first quarter of 2023. I have been over that in great detail so I won’t do that again. I will say this tonight. I know that some of you newcomers are skeptical. Go back and look at some of the pervious blogs in the archives and see how this all unfolded. Talk to your friends. See what we made week by week month by month and year by year. You have always heard one thing here. Seek God first and then do what works best for you. Do what is best for your family. I only want to see you do the best that you can do. Those of you that have been with me through the years already know that. I only said this for the benefit of those who are new to our group in light of all the criticism we receive during and after the aforementioned 15 month period.
The days trading left us with the following results: Our TSP allotment posted a gain of +0.12%. For comparison, the Dow was flat at -0.01%, the Nasdaq fell -1.16%, and the S&P 500 dropped -0.45%.
Nasdaq sheds 1% on Monday as investors dump tech names to start final week of June: Live updates
The days trading left us with the following signals: C-Sell, S-Sell, I-Sell, F-Buy. We are currently invested at 100/F. Our allocation is now -2.11% on the year. Here are the latest posted results:
| 06/26/23 | Prior Prices | ||||
| Fund | G Fund | F Fund | C Fund | S Fund | I Fund |
| Price | 17.5576 | 18.6968 | 66.9539 | 66.8825 | 37.3317 |
| $ Change | 0.0056 | 0.0301 | -0.3001 | 0.1580 | 0.0008 |
| % Change day | +0.03% | +0.16% | -0.45% | +0.24% | +0.00% |
| % Change week | +0.00% | +0.00% | +0.00% | +0.00% | +0.00% |
| % Change month | +0.00% | +0.00% | +0.00% | +0.00% | +0.00% |
| % Change year | +1.87% | +2.69% | +13.67% | +8.70% | +9.99% |