
Good Evening, Yesterday we put in an interfund transfer order to sell our equities and go to bonds. Using stiffer indicators, we waited until the last minute to avoid the dreaded V shaped bounce that has occurred on an almost automatic basis for the past 5 years. Prior to 2009 we ran our normal indicators and sold correctly most of the time, but the past 5 years that simply has not been the case. So I wondered as the sell signals started to pile up, Will it happen again this time? After all we’re using stiffer indicators. Surely we won’t get caught in yet another reversal! As the order went in, I watched as the stocks bottomed and moved back up from triple digit losses until they were back in the green. All the major indices finished well in the profit range staving off disaster yet again. I started to get that sick feeling in my stomach as I though that maybe I had been caught in another reversal. At that point all I could do was wait until the next open to see if the market would follow through on the afternoons action. After all, as I had mentioned to every one the previous night, we still did not have a Greek deal and things were looking pretty messed up in China. Could our market really ignore the second largest market in the world falling apart? It was sure beginning to look like it. Nevertheless, I had followed my chart and not my heart. Then, when I got up at 0 dark thirty this morning to check the futures a strange thing (at least in the past five years) happened. The futures were down big on concerns about China and Greece! Yesterday afternoon ended up being a classic bull trap and this time it was the perma bulls and dip buyers that were feeling the pain! By the time the day was over all of the major indices had incurred deep triple digit losses and our TSP allotment which was now invested at 100/F managed a modest gain. May God be praised! He has never let our group down!
All that said, we mustn’t stop praying now. This is still a difficult market. You can be balanced perfect on one day and leaning totally the wrong way on the next. That is the very definition of volatility. Technical Analysis is not magic! However, it is effective risk management! If we stick to our charts and continue to trust in God, we will have more success. We will stay on the right side of this market as long as we have the trades to do so.
The days sell off left us with the following results: Our TSP allotment gained +0.24%. For comparison, the Dow lost -1.47%, the Nasdaq -1.75%, and the S&P 500 -1.67%. Now that’s the way it’s done! Thank God for his guidance. Give Him all the praise!
Wall St. sharply lower on China fears; NYSE suffers outage
The days action left us with the following signals: C-Sell, S-Sell, I-Sell, F-Neutral. We are currently invested at 100/F. Our allocation is now +2.06% on the year not including the days results. Here are the latest posted results:
| 07/07/15 | |||||
| Fund | G Fund | F Fund | C Fund | S Fund | I Fund |
| Price | 14.7627 | 16.896 | 27.7605 | 38.1387 | 25.3566 |
| $ Change | 0.0018 | 0.0340 | 0.1681 | 0.1192 | -0.1281 |
| % Change day | +0.01% | +0.20% | +0.61% | +0.31% | -0.50% |
| % Change week | +0.03% | +0.73% | +0.23% | +0.09% | -2.46% |
| % Change month | +0.04% | +0.51% | +0.91% | +0.11% | -1.71% |
| % Change year | +1.00% | +0.56% | +2.19% | +5.08% | +4.70% |
| L INC | L 2020 | L 2030 | L 2040 | L 2050 | |
| Price | 17.7086 | 23.4242 | 25.4713 | 27.1598 | 15.442 |
| $ Change | 0.0140 | 0.0310 | 0.0424 | 0.0523 | 0.0310 |
| % Change day | +0.08% | +0.13% | +0.17% | +0.19% | +0.20% |
| % Change week | -0.03% | -0.25% | -0.33% | -0.37% | -0.46% |
| % Change month | +0.09% | +0.05% | +0.05% | +0.05% | +0.01% |
| % Change year | +1.48% | +2.29% | +2.68% | +2.96% | +3.23% |
Lets take a look at the charts: (All signals annotated with Green Circles)
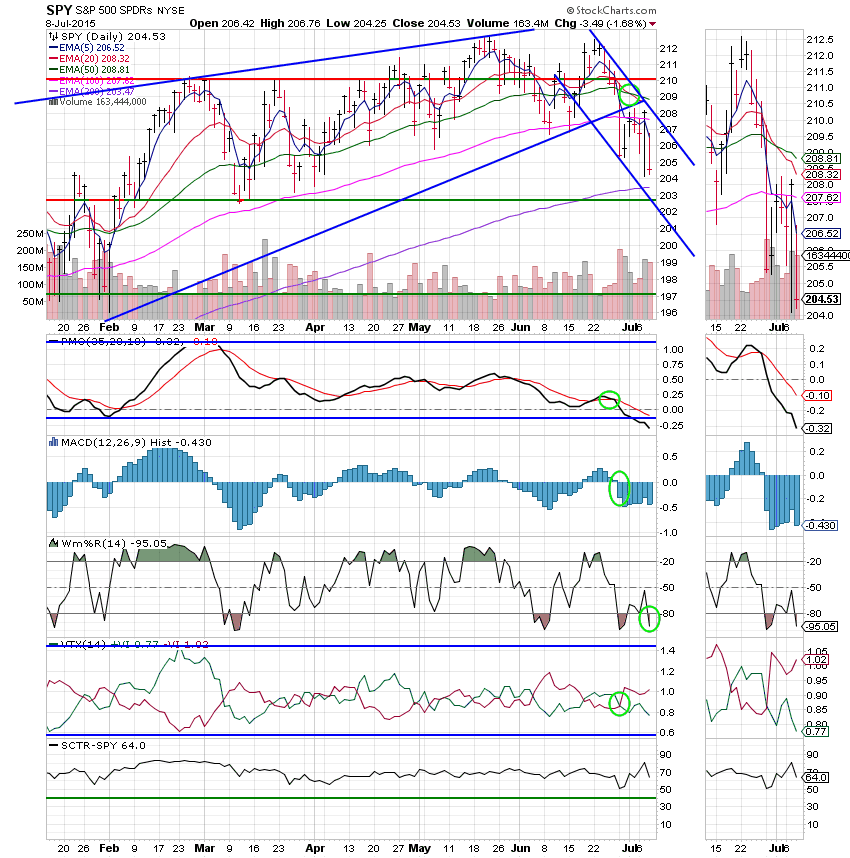
C Fund: All five indicators are in negative configurations and the SCTR has dropped to 64.0. This one is a sell.
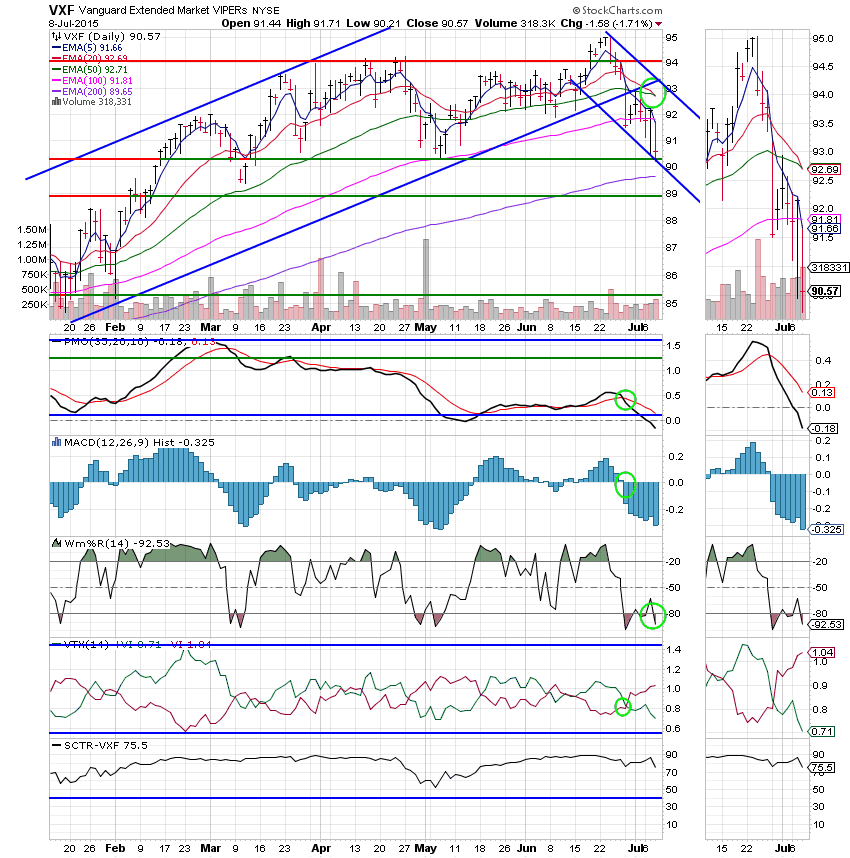
S Fund: The 20 EMA crossed through the 50 EMA to generate the sell signal that we were looking for yesterday. Our timing on the sale of this fund could not have been better. Give God all the praise! All five indicators are now in negative configurations.
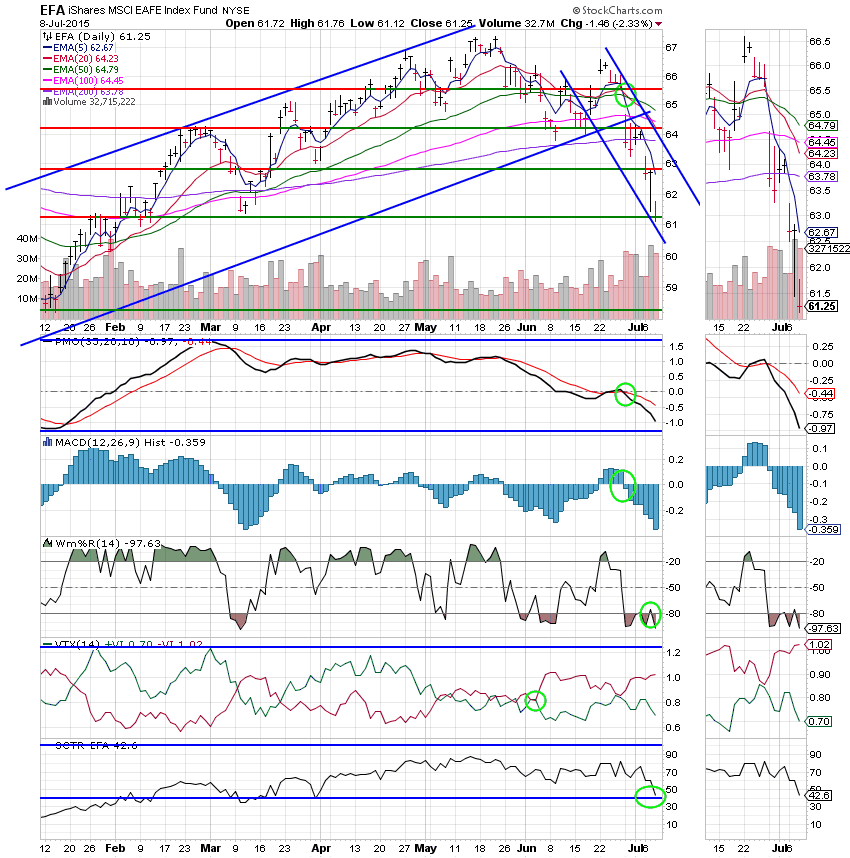
I Fund: Price dropped to support at 61.25 with an overall loss of 2.33%. All five indicators are in negative configurations and the SCTR has now dropped to 42.6. This Fund is in a free fall!
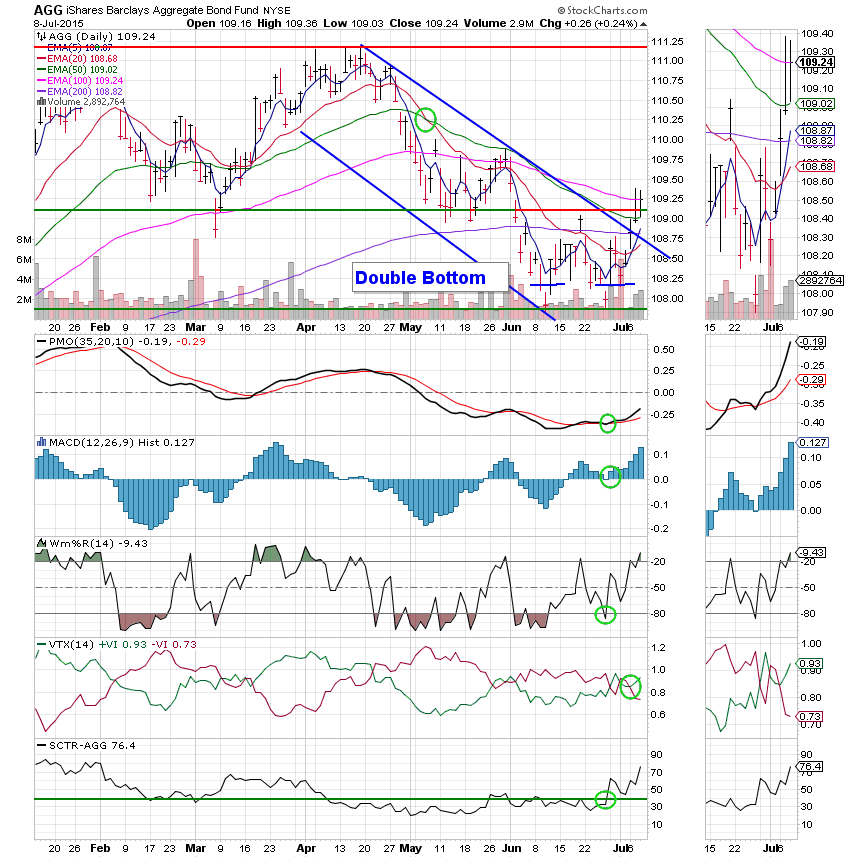
F Fund: Price broke through resistance at 109.12 and reclaimed it’s 100 EMA at 109.25. The double bottom pattern has clearly executed. The PMO, MACD, and Williams %R are all in positive configurations giving the F Fund an overall Neutral signal. However, I will add that this Neutral is improving. This improvement is reflected by the SCTR which has skyrocketed to 76.4 in comparison to other Funds.
The thing to keep in mind about the current market is that it is headline driven with the two man issues being Greece and China. Not necessarily in that order. As I mentioned above, you can be invested perfect on one day and leaning the wrong way on the next. So we must remain extremely vigilant, keeping a close eye on our charts. In the event that this market does make a U turn which it could easily do with the right news, we need to be ready to react to any sell signals that we get. Given the current technical damage that has been done to our equity based charts, we should have ample time to jump back in if it becomes necessary to do so. That all for tonight! May God continue to bless your trades.