
Good Evening, A few earnings reports disappointed and the market dropped for the third consecutive day. There were a few good reports as well, but they weren’t enough to bring things up. Very few stocks were working today with some of the recent momentum names such as PYPL and FB suffering as well. There was really not place to hide.
The days trading left us with the following results: Our TSP allotment dropped -0.53%. For comparison the Dow lost -0.67%, the Nasdaq -0.49%, and the S&P 500 -0.57%.
Wall Street falls for third day as earnings fall short
The days action left us with the following signals: C-Buy, S-Neutral, I-Neutral, F-Neutral. We are currently invested at 33/C, 33/S, 34/I. Our allocation is now 0.66% on the year not including the day’s results. Here are the latest posted results:
| 07/22/15 | |||||
| Fund | G Fund | F Fund | C Fund | S Fund | I Fund |
| Price | 14.7765 | 16.8487 | 28.2162 | 38.2259 | 26.2217 |
| $ Change | 0.0009 | 0.0148 | -0.0645 | 0.0379 | -0.3090 |
| % Change day | +0.01% | +0.09% | -0.23% | +0.10% | -1.16% |
| % Change week | +0.03% | +0.11% | -0.57% | -0.72% | -0.91% |
| % Change month | +0.14% | +0.23% | +2.57% | +0.34% | +1.65% |
| % Change year | +1.09% | +0.28% | +3.87% | +5.32% | +8.27% |
| L INC | L 2020 | L 2030 | L 2040 | L 2050 | |
| Price | 17.7852 | 23.6605 | 25.7906 | 27.5361 | 15.6867 |
| $ Change | -0.0130 | -0.0524 | -0.0725 | -0.0855 | -0.0575 |
| % Change day | -0.07% | -0.22% | -0.28% | -0.31% | -0.37% |
| % Change week | -0.11% | -0.33% | -0.44% | -0.51% | -0.59% |
| % Change month | +0.52% | +1.06% | +1.30% | +1.44% | +1.60% |
| % Change year | +1.92% | +3.33% | +3.97% | +4.39% | +4.87% |
Lets take a look at the charts: (All signals annotated with Green Circles)
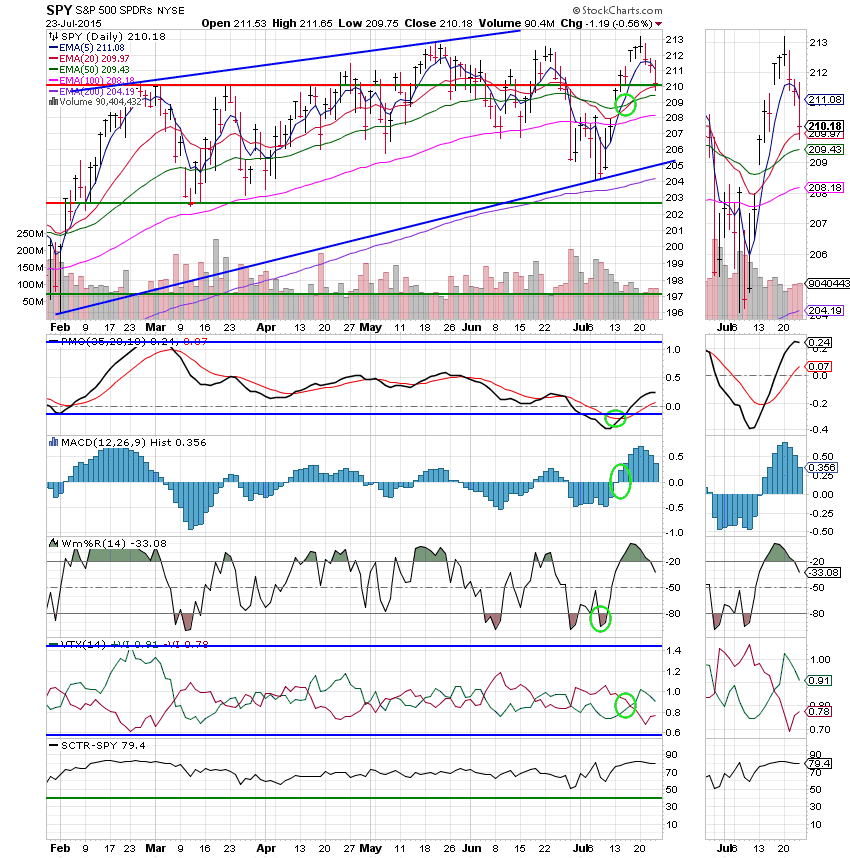
C Fund: Price tested resistance at just above 210 and it held closing right at the same level. That was good enough to keep all of the indicators in positive configurations so this one is still a buy.
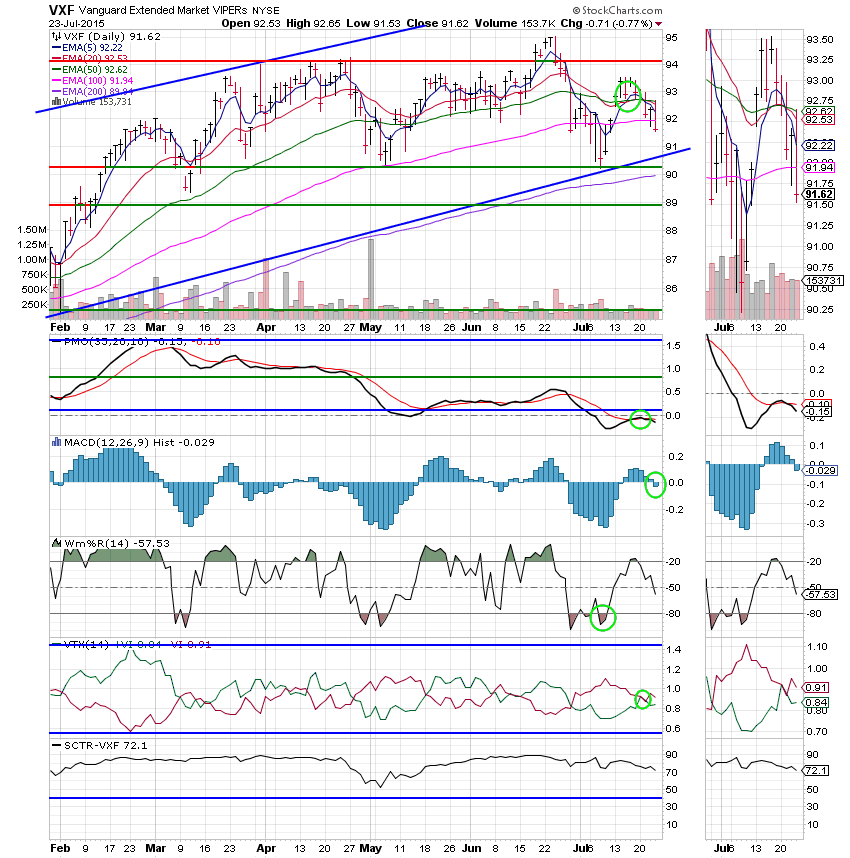
S Fund: Price continued to drop closing below it’s 100 EMA. The MAC D moved into a negative configuration leaving only the Williams %R positive. Should the Williams %R also turn negative an overall sell signal will be generated for this chart.
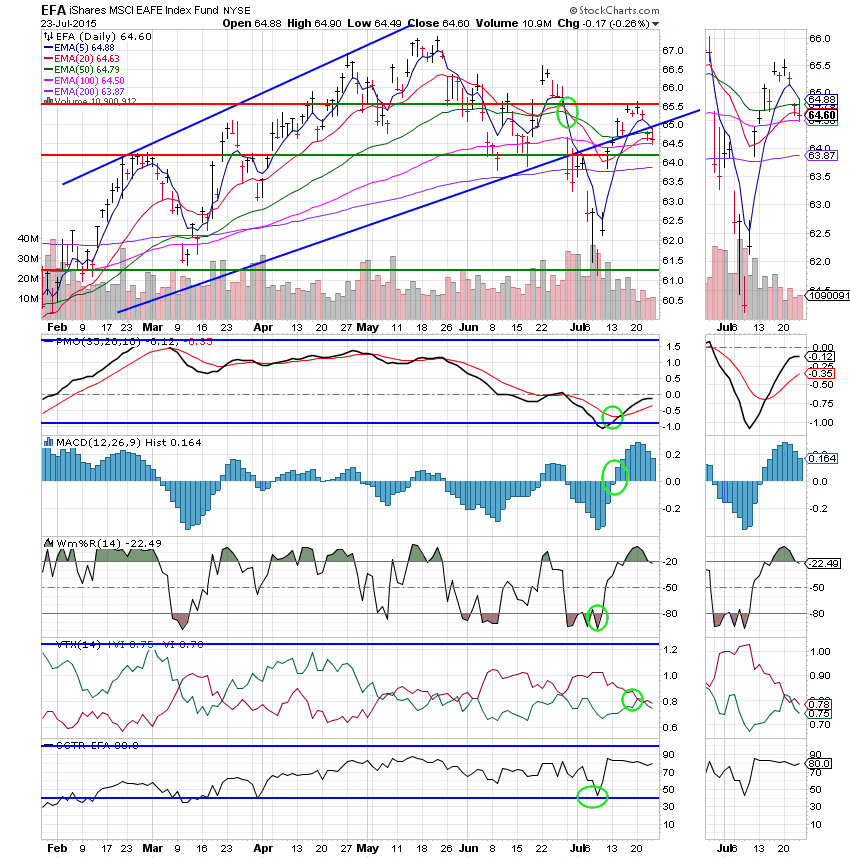
I Fund: Price closed right on it’s 20 EMA which remains under the 50 EMA. However, this chart continues to be neutral as the PMO, MAC D, and Willaims %R all remain in positive configurations.
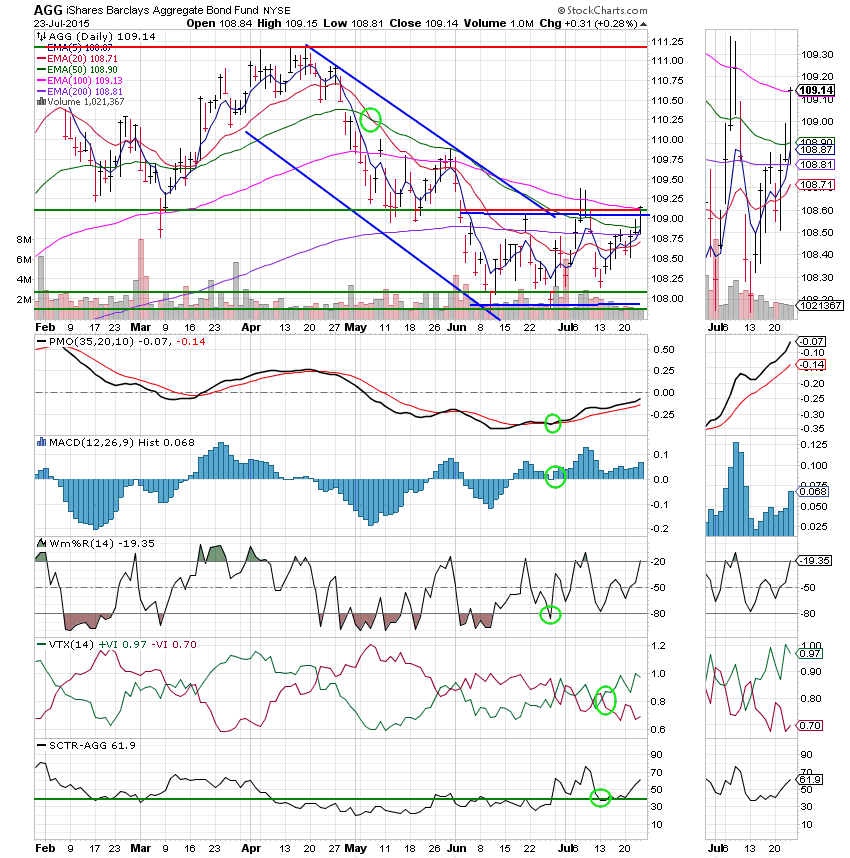
F Fund: Price managed a nice gain today and reclaimed it’s 100 EMA in the process. In addition, it broke above the upper trend line of the trading channel that it had been in since the middle of June. All indicators with the exception of price are in positive configurations and continue to improve. This Fund may have found the bottom. Additional improvement here will most likely be spurred on if there is further weakness in stocks.
The bottom line is that bonds are improving and stocks are weakening. That is not a good recipe, but this market has turned in the opposite direction each time that it has threatened to make a sustained move one way or the other. I suspect that this time will be no different. For that reason, I will not move out of equities until a get a clear sell signal in all three of our equity based funds. That’s all for tonight. May God continue to guide our hand!