Good Evening. The Chinese market started dropping again to the tune of 8.5%. That’s right, 8.5% in one day! All those folks who have been thinking that what happens over there doesn’t effect us here failed to take into account that China is the 2nd largest economy in the world. In this day when world economies are linked, that matters. After all, if a little country like Greece with a total economy the size of Proctor and Gamble can effect the market the way that it did, then how much more will the number two economy in the world do when it goes into a tail spin? It’s really a no brainer and if you throw in the market manipulation by the communist government, then you’ve got a big mess. So far, the sagging Chinese economy has led to five losing days in our domestic markets. I’m praying that this trend will reverse and soon!
The day’s selling left us with the following results: Our TSP allotment dropped -0.786%. For comparison, the Dow lost -0.73%, the Nasdaq -0.96%, and the S&P 500 -0.58%. It was a rough day.
Wall Street drops as China stock slump stokes growth fears
The days action left us with the following signals: C-Neutral, S-Sell, I-Neutral, F-Neutral. We are currently invested at 33/C, 33/S, 34/I. Our allocation is now -0.69% on the year not including the days results. Here are the latest posted results:
| 07/24/15 | |||||
| Fund | G Fund | F Fund | C Fund | S Fund | I Fund |
| Price | 14.7784 | 16.8788 | 27.7581 | 37.5357 | 26.0648 |
| $ Change | 0.0010 | -0.0008 | -0.3000 | -0.4226 | -0.2251 |
| % Change day | +0.01% | +0.00% | -1.07% | -1.11% | -0.86% |
| % Change week | +0.04% | +0.29% | -2.18% | -2.52% | -1.50% |
| % Change month | +0.15% | +0.41% | +0.91% | -1.48% | +1.04% |
| % Change year | +1.11% | +0.46% | +2.18% | +3.41% | +7.62% |
| L INC | L 2020 | L 2030 | L 2040 | L 2050 | |
| Price | 17.7392 | 23.5049 | 25.5665 | 27.2555 | 15.5067 |
| $ Change | -0.0354 | -0.1187 | -0.1692 | -0.2093 | -0.1349 |
| % Change day | -0.20% | -0.50% | -0.66% | -0.76% | -0.86% |
| % Change week | -0.36% | -0.98% | -1.30% | -1.52% | -1.73% |
| % Change month | +0.26% | +0.40% | +0.42% | +0.40% | +0.43% |
| % Change year | +1.65% | +2.65% | +3.07% | +3.32% | +3.66% |
Here are the charts. (All signals annotated with Green Circles)
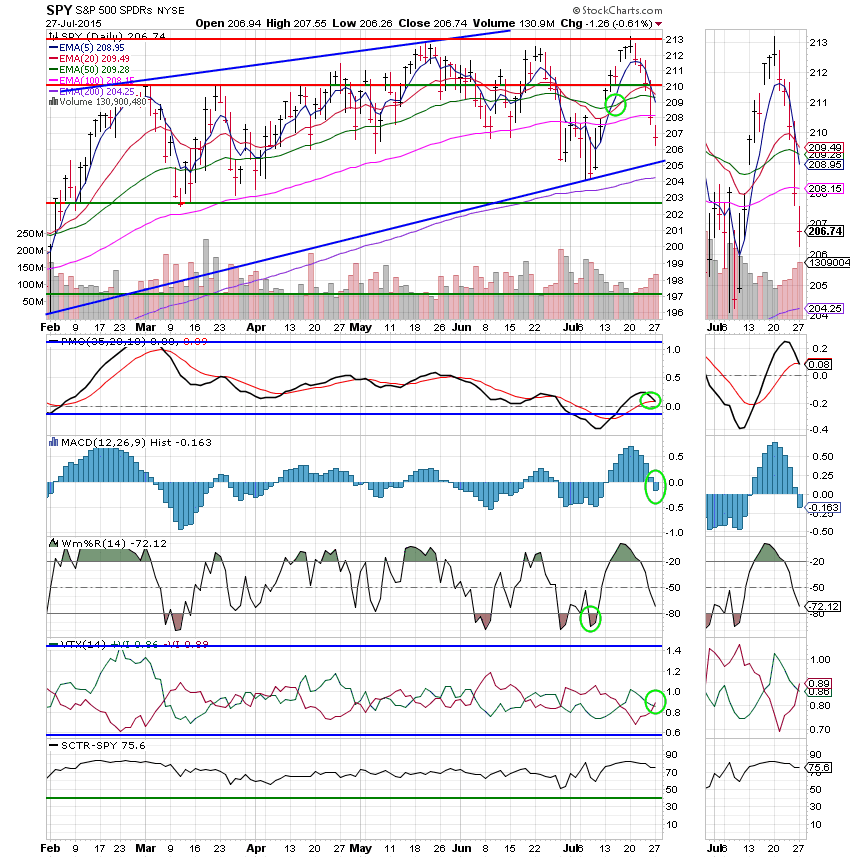
C Fund: The C Fund now has three indicators in negative configurations. The PMO, MACD, and the VTX. The Williams %R and Price are still hanging in there to give the Fund an overall neutral signal, but not by much. Price closed for the second consecutive day below it’s 100 EMA, but still remains above the lower trend line and 200 EMA. This chart is starting to look oversold.
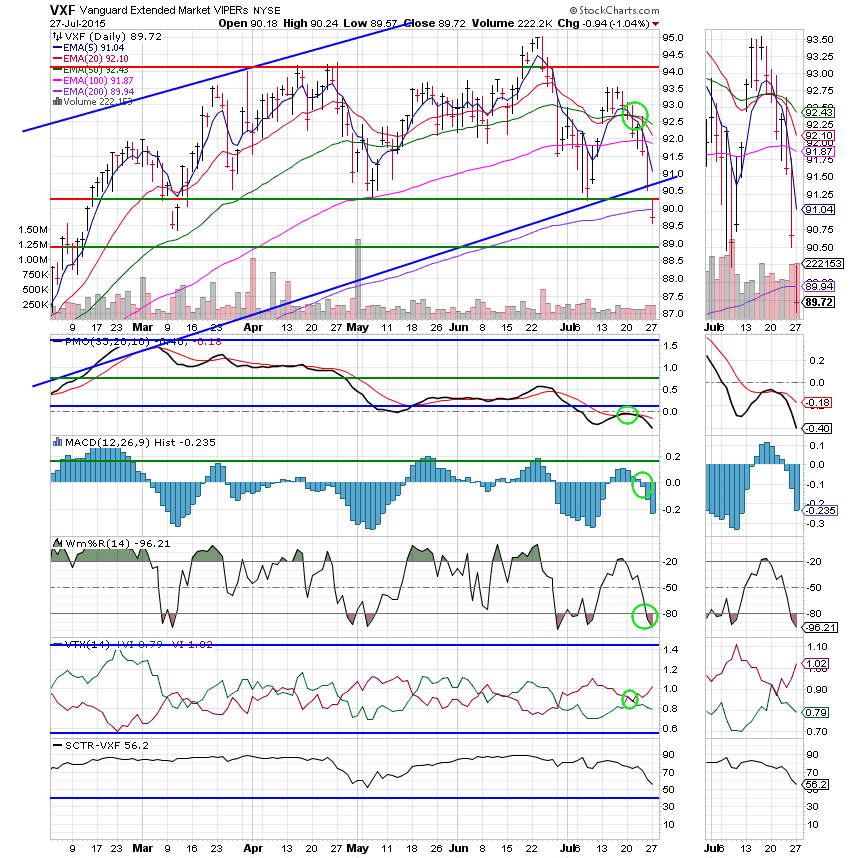
S Fund: This chart now has all indicators in negative configurations for an overall sell signal. Small caps are suffering and this chart shows it. That said, it’s getting a bit oversold and looks primed for a bounce. Should you choose, you can move any money that you have allocated here to the G Fund. However, given the recent market history of V shaped recoveries and the way that it has punished those taking defensive action, I’m going to give this fund every chance to turn around before I sell. I am looking to the S&P 500 to guide my decision on whether or not to sell equities.
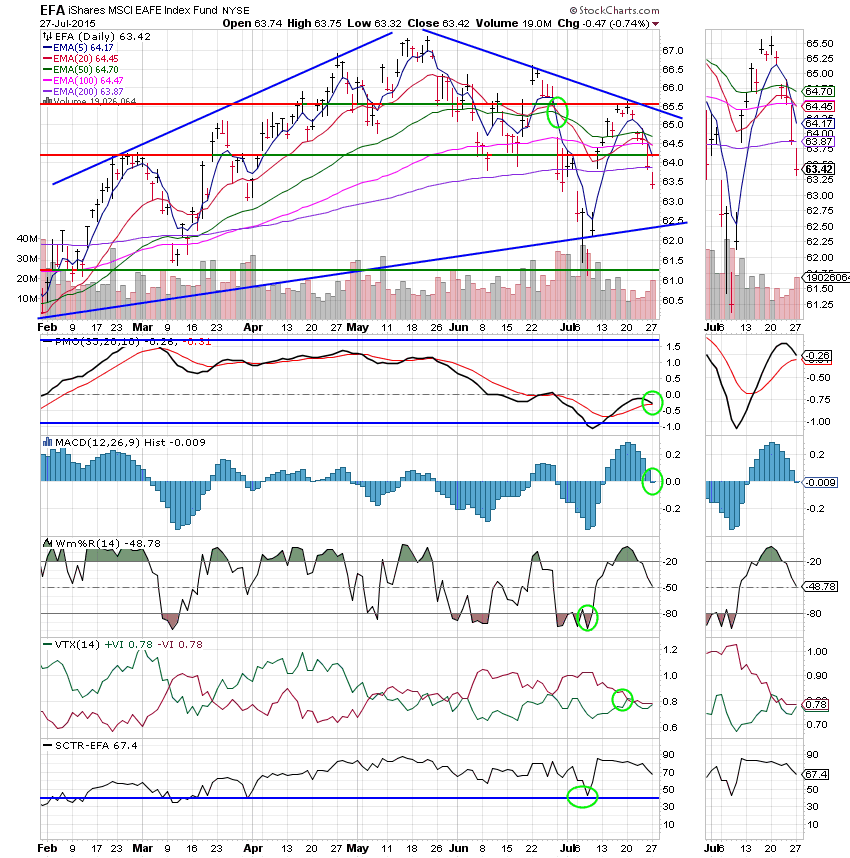
I Fund: Price closed below the 200 EMA today which is bearish. Also, the MACD moved into a negative configuration. The PMO is close to making a negative crossover as well, but a close look at the thumbnail will show that it has not done so just yet. The Williams %R remains positive but will soon reach negative territory as well with a few more days of negative action. On the positive side the VTX is threatening to go bullish. Could this be signaling a bottom? That would be nice!
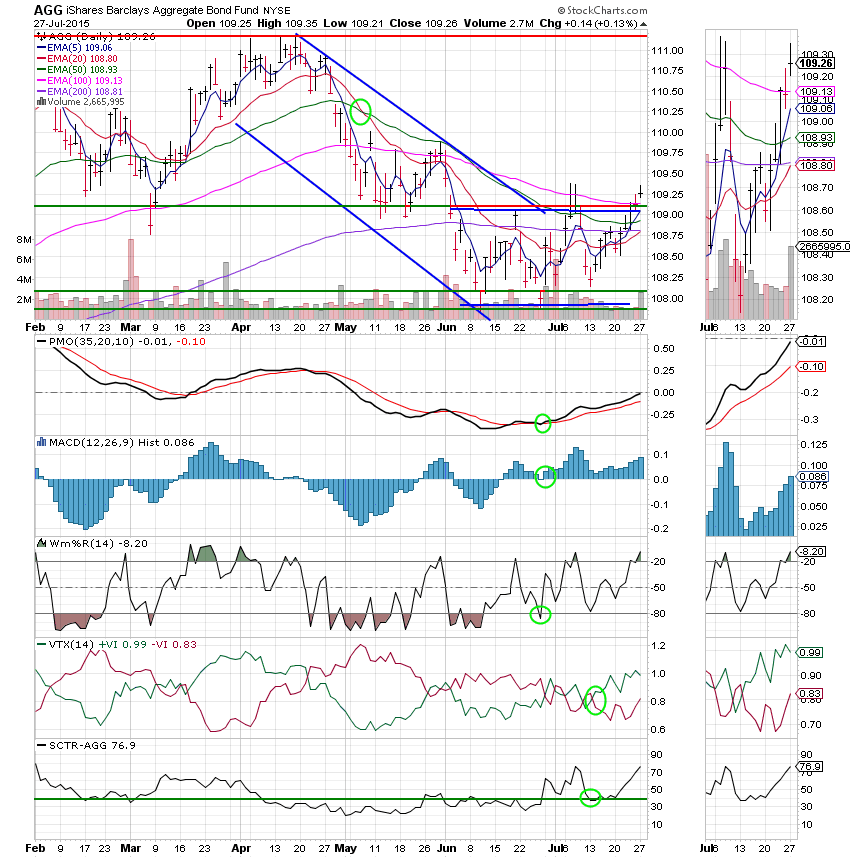
F Fund: Price closed above it’s 100 EMA and above all resistance. The F Fund is clearly responding to the negative action in stocks. The PMO has now entered neutral territory and Williams %R has become overbought. Each time the Williams %R has reached this level since April it has signaled a reversal in the bond market. Could this be a signal that equities are going to reverse as well? These are things we need to watch.
No doubt about it. The charts are starting to take some hits. They are becoming oversold and could support a bounce. We are nearing a pivotal point when the market will bend or break. Based on the charts, I believe we will experience some kind of bounce in the next day or so. The question is, will it be a dead cat bounce or will it end the current slide. Only time will tell. Until then we’ll have to keep a close eye on out charts and pray for God’s guidance. We’ll have two fresh trades to work with after Friday. That will help. That’s all for tonight. May God continue to bless your trades! See you tomorrow.


