Good Evening, Well the market ended mixed after thrashing around inside the same trading zone that it has been in the past two weeks. Is it topping?? I think it may be, but I have no definitive proof. The only thing I have is a bunch of extended charts in need of a rest coupled with the worst time of the year seasonally for the market. By all rights and reasons this market is overdue for a pullback. However, markets can remain in a trend a lot more time than we would think to be reasonable. All we can do at this point is continue to wait as we have for the past two weeks for this overdue pullback and the better entry point into the equity market that it will bring. The danger in chasing an extended market such as this is that it can turn down as soon as you jump back in erasing any gains that you were protecting by being in bonds or cash in the first place. That safe haven was your insurance policy and the bill for that insurance policy is any gains the market may accrue while you are sitting out. Of course, the flip side would be if the insurance policy paid off by protecting you against catastrophic loss should the market turn into a bear which it can do at any time. While you may forgo some gain, the most important thing is to keep what you already have. Remember, it’s not what you make that’s important, it’s what you keep!
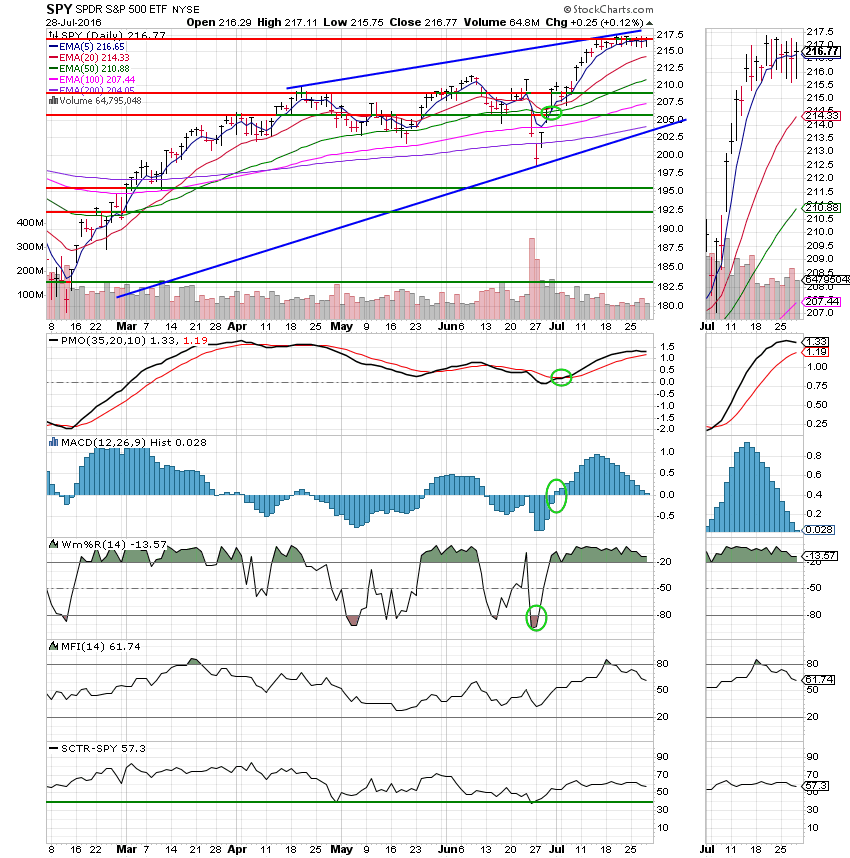
The days trading left us with the following results. Our TSP allotment was flat at -0.01%. For comparison, the Dow slipped back -0.09%, the Nasdaq gained +0.03%, and the S&P 500 added +0.16%.
Wall St. edges up; Alphabet and Amazon rise after the bell
The days action left us with the following signals: C-buy, S-Buy, I-Neutral, F-Neutral. We are currently invested at 100/F. Our allotment is now +1.63% on the year not including the days results. Here are the latest posted results.
| 07/27/16 | Prior Prices | ||||
| Fund | G Fund | F Fund | C Fund | S Fund | I Fund |
| Price | 15.0709 | 17.9514 | 29.5853 | 37.9377 | 24.027 |
| $ Change | 0.0006 | 0.0414 | -0.0343 | -0.0659 | 0.0731 |
| % Change day | +0.00% | +0.23% | -0.12% | -0.17% | +0.31% |
| % Change week | +0.02% | +0.21% | -0.38% | +0.11% | +0.62% |
| % Change month | +0.11% | +0.36% | +3.34% | +4.82% | +3.27% |
| % Change year | +1.04% | +5.88% | +7.34% | +7.67% | -0.28% |
| L INC | L 2020 | L 2030 | L 2040 | L 2050 | |
| Price | 18.1787 | 23.9722 | 26.0909 | 27.7656 | 15.742 |
| $ Change | 0.0031 | 0.0039 | 0.0040 | 0.0040 | 0.0015 |
| % Change day | +0.02% | +0.02% | +0.02% | +0.01% | +0.01% |
| % Change week | +0.02% | +0.02% | +0.02% | +0.02% | +0.01% |
| % Change month | +0.81% | +1.64% | +2.31% | +2.68% | +3.04% |
| % Change year | +2.28% | +3.29% | +4.10% | +4.49% | +4.76% |