Good Evening,Someone asked me to describe the current market to them. I had to think about it because it’s really unique. As of today we have been through the shortest bear market in history. More on that later… Our accounts have been back and forth and back and forth again, each time feeling like the market would move in that direction for the foreseeable future only to reverse and move the other way in a few days or a week. One central theme throughout has been that after all the up and down movement the market has been able to make steady progress to the upside. So……How do I describe it??? After careful thought I would say three steps forward and two steps back. Yep, I think that nails it! I don’t know how other folks did it without charts. It was easy to see on our charts with a moderate time frame but other than that…Well it was the fake out before the breakout.
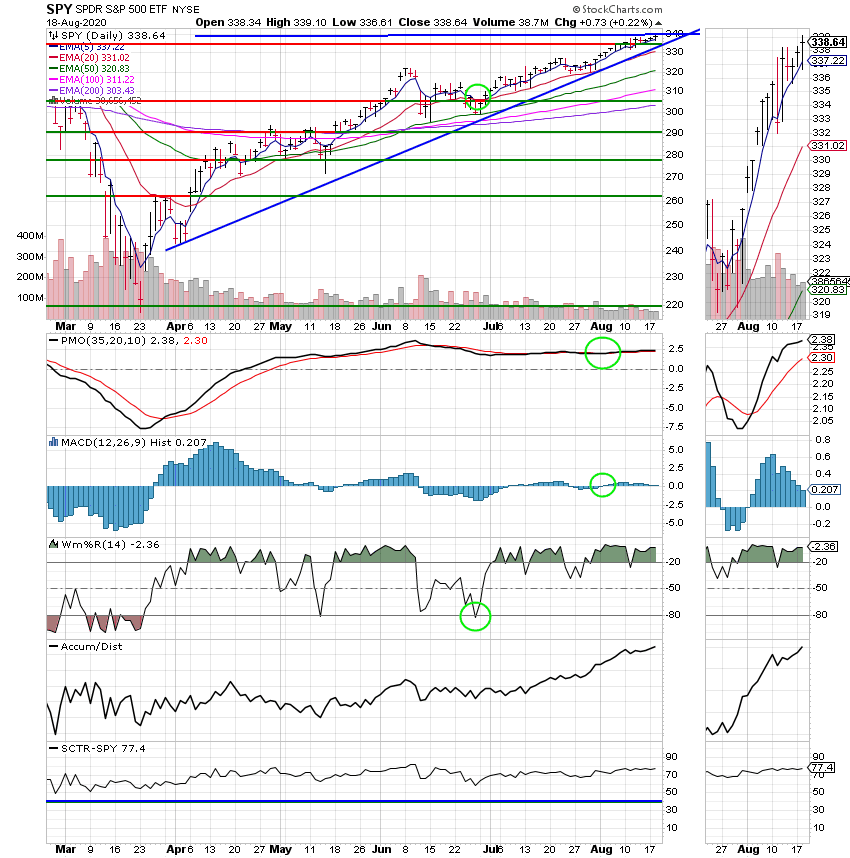
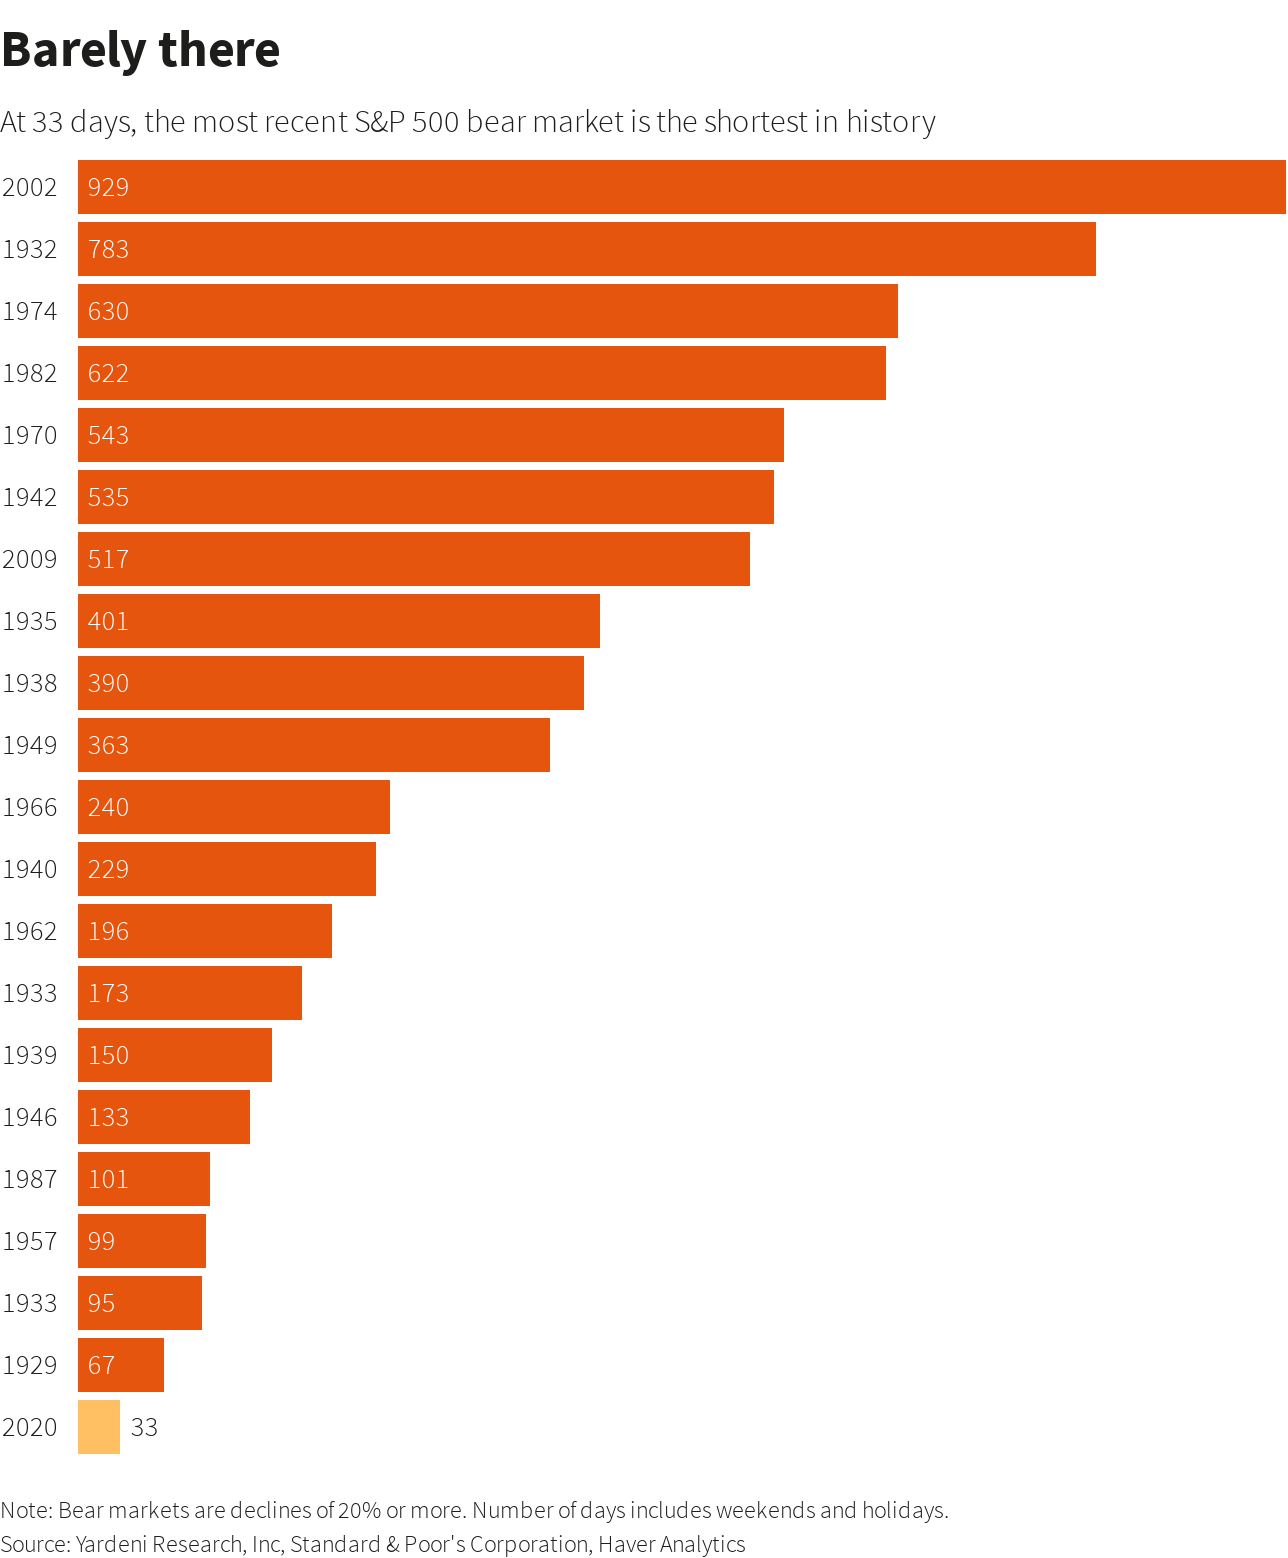
The market was bifurcated today with the S&P and the Nasdaq moving higher to a new records while the Dow posted a loss… All this while the overall breadth was negative……Declining issues outnumbered advancing ones on the NYSE by a 1.40-to-1 ratio; on Nasdaq, a 1.66-to-1 ratio favored decliners. Back to that S&P record. The S&P 500’s record closing high on today confirmed that the coronavirus-fueled bear market of 2020 was by far the shortest ever. Measured from the indexes previous record high on Feb. 19 to its trough on March 23, the pandemic-induced bear market lasted only 33 days, compared to the median age of 302 days of 20 bear markets going back to the 1920s, according to Yardeni Research data.
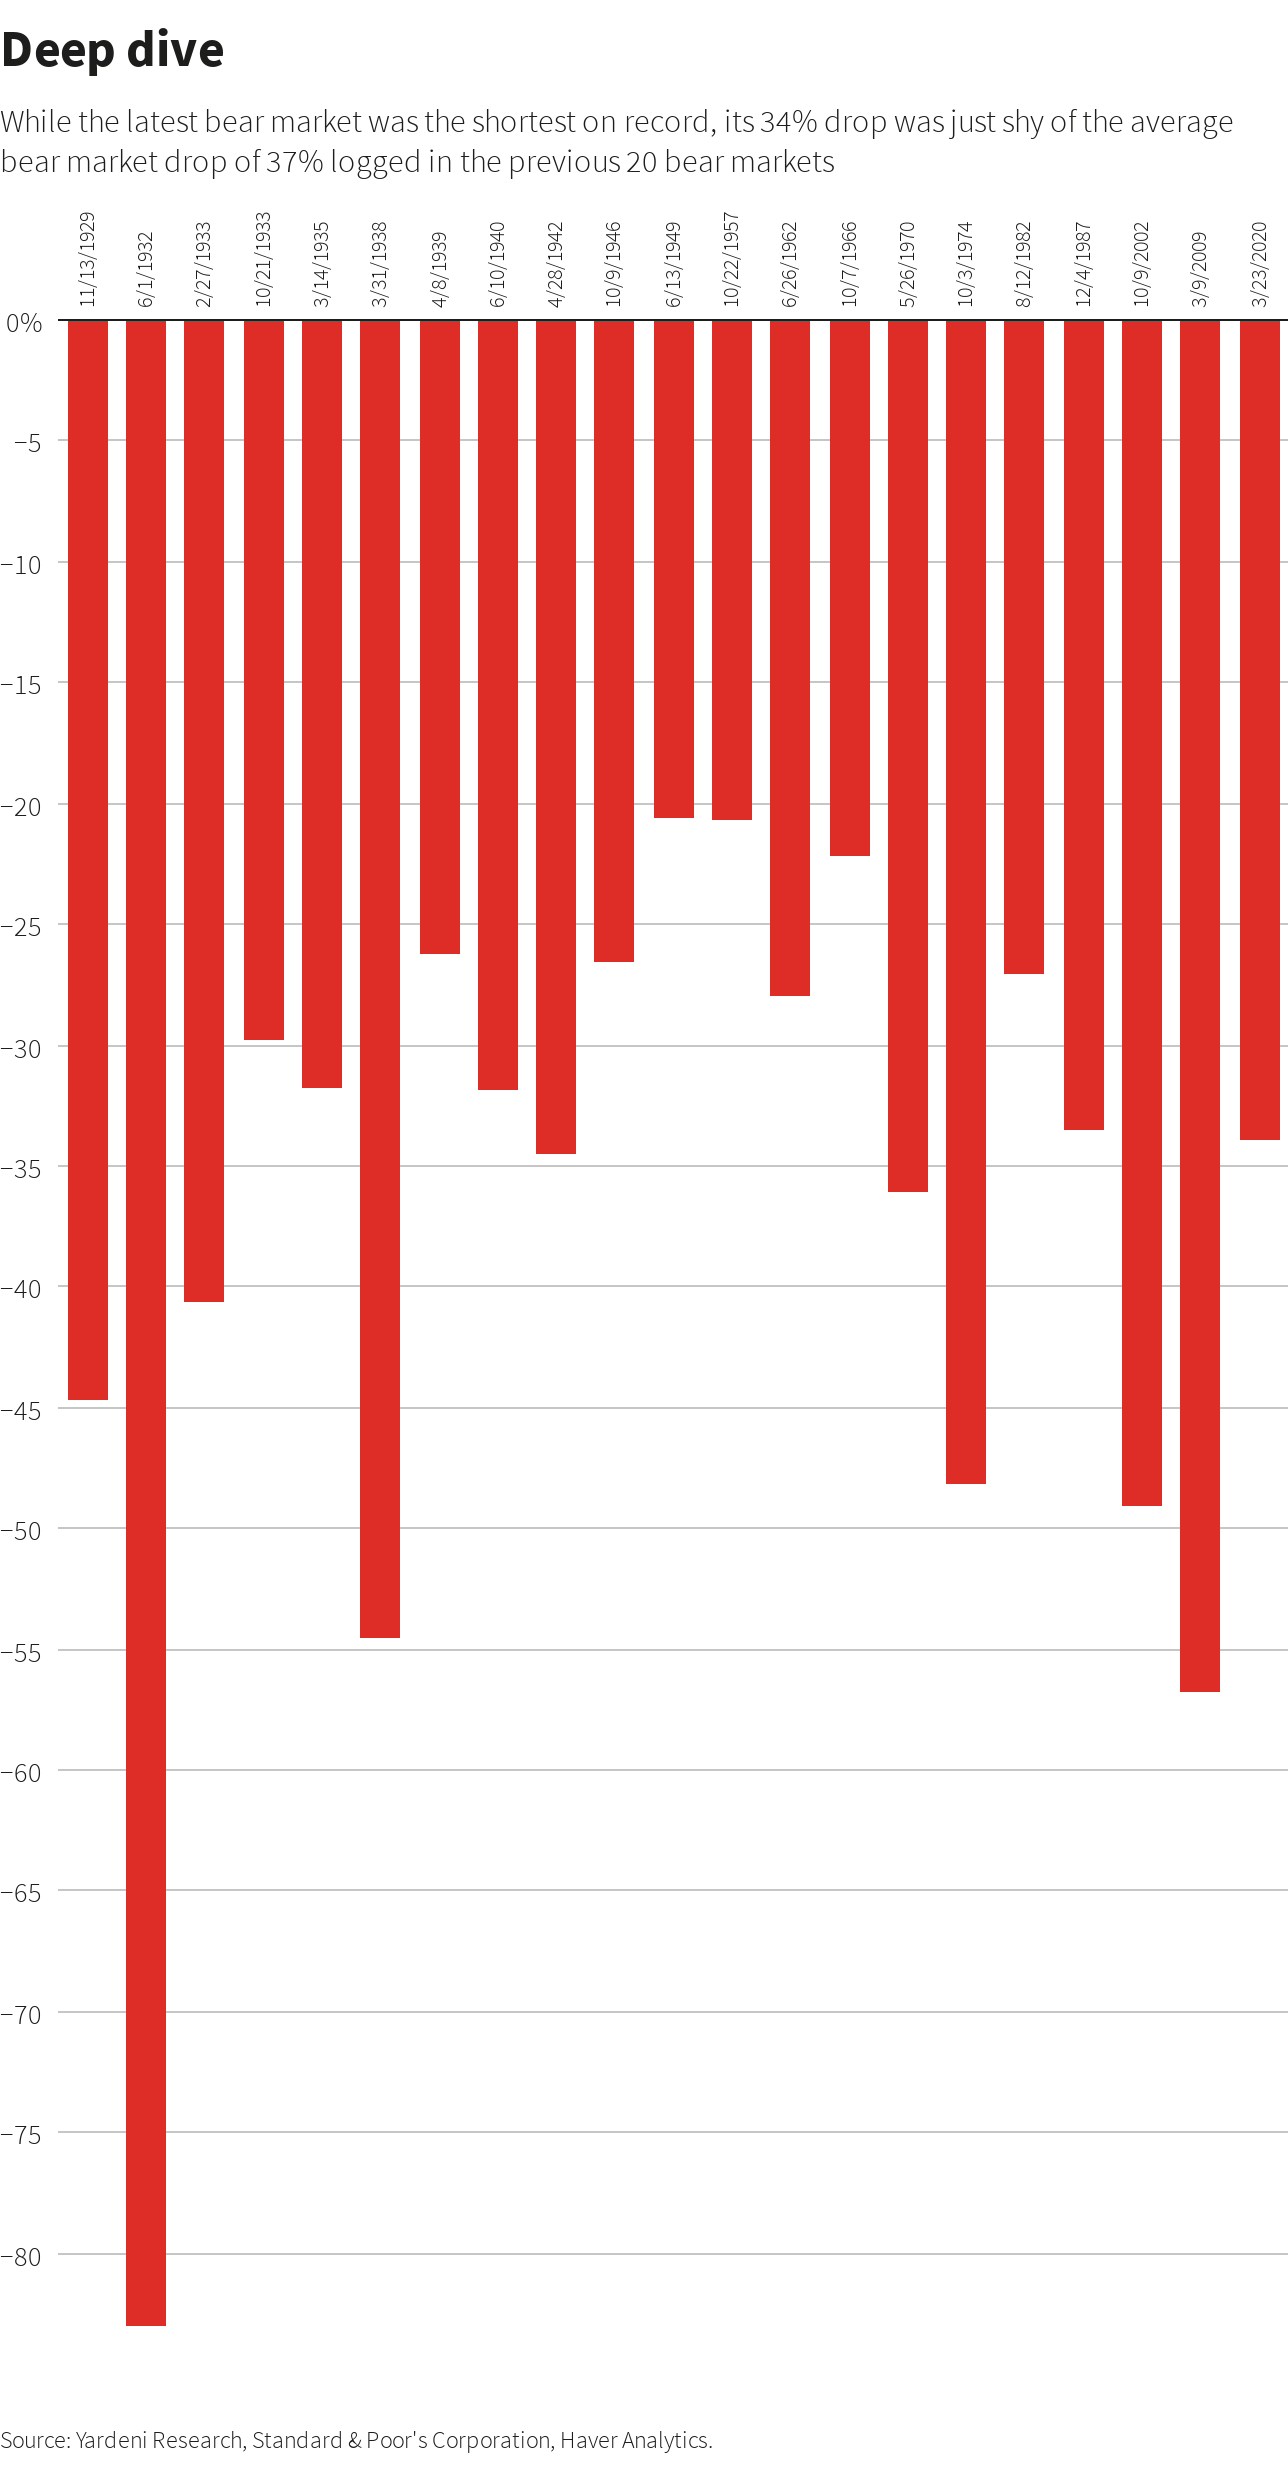
While 2020’s bear market was the S&P 500’s shortest-lived, it still packed a punch. The index fell 34% from its February high to its March low, just slightly below its average bear market loss of 37%.
There you have it and we survived it. So now we’re in a bull market again. How long will it last? I haven’t the faintest idea. Remember, I just watch the charts. When this one ends whether it is the shortest bull market in history or if it survives to a ripe old age we will sell when our charts tell us to sell, Just like we did in 2000, 2008, and 2020. Our God has never let this group down. Not even once. Seek Him and watch your charts and you will never fail. Even more importantly, come to know His son Jesus and you will receive eternal life where the paving material you walk on will be the gold that we seek on this earth…… and that folks is far more valuable than TSP. I don’t mean to chase rabbits so to speak but sometimes you just have to give credit where credit is due. Give God all the praise and glory for He and He alone is worthy!!
The days trading left us with the following results: Our TSP allotment slipped -0.37%. For comparison, the Dow dropped -0.24%, the Nasdaq was up +0.73%, and the S&P 500 set a new record posting a modest gain of +0.23%.
The days action left us with the following signals: C-Buy, S-Buy, I-Buy, F-Neutral. We are currently invested at 100/S. Our allocation is now +26.55% on the year. Here are the latest posted results:
| 08/18/20 | Prior Prices | ||||
| Fund | G Fund | F Fund | C Fund | S Fund | I Fund |
| Price | 16.4618 | 21.0831 | 50.1581 | 58.7357 | 31.2359 |
| $ Change | 0.0002 | 0.0108 | 0.1230 | -0.2312 | 0.0510 |
| % Change day | +0.00% | +0.05% | +0.25% | -0.39% | +0.16% |
| % Change week | +0.01% | +0.13% | +0.52% | +0.71% | +0.45% |
| % Change month | +0.03% | -0.68% | +3.73% | +4.86% | +4.93% |
| % Change year | +0.68% | +6.93% | +6.13% | +4.37% | -4.53% |
| Fund | L INC | L 2025 | L 2030 | L 2035 | L 2040 |
| Price | 21.5674 | 10.4343 | 35.7166 | 10.5735 | 39.4366 |
| $ Change | 0.0072 | 0.0071 | 0.0285 | 0.0091 | 0.0359 |
| % Change day | +0.03% | +0.07% | +0.08% | +0.09% | +0.09% |
| % Change week | +0.13% | +0.27% | +0.33% | +0.36% | +0.39% |
| % Change month | +0.92% | +2.11% | +2.54% | +2.79% | +3.04% |
| % Change year | +1.80% | +4.34% | +2.48% | +5.74% | +2.62% |
| Fund | L 2045 | L 2050 | L 2055 | L 2060 | L 2065 |
| Price | 10.6694 | 23.0839 | 10.86 | 10.8601 | 10.8602 |
| $ Change | 0.0101 | 0.0226 | 0.0123 | 0.0123 | 0.0123 |
| % Change day | +0.09% | +0.10% | +0.11% | +0.11% | +0.11% |
| % Change week | +0.42% | +0.44% | +0.52% | +0.52% | +0.52% |
| % Change month | +3.26% | +3.48% | +4.29% | +4.29% | +4.29% |
| % Change year | +6.69% | +2.67% | +8.60% | +8.60% | +8.60% |