Good Morning, I said it before and I’m going to say it again. The overall trend is moving higher, but there is going to be more volatility. In simple terms, this market is not going to move straight up. Not gonna happen. It will continue to react to every major earnings and economic report that is issued looking for clues related to what the Feds next move will be along with any hints of a possible recession. Overall, the market has been looking for a soft landing for the economy for months. However, there is still a panic reaction every time that a news or economic report doesn’t go along with that scenario. I think the reactions are much more volatile than they used to be because of all the computer trading. I like to call it video game trading. A lot of folks sitting around with their phones wherever they might be reacting to every push notification they see on their screen. No evaluation, no thought, no plan just buy and sell. It’s going up so we need to jump in or this is a bad report so we need to get out. Add all that to the high speed computer algorithms that the market makers are using which are programed to key in on certain terms are phrases (you might as well call that panic too) and you have a volatile mix unlike we have ever seen before. Big swings in the market that make it virtually impossible for the average trader to assess exactly where they are. Another point that I have made and I will make again is that this volatility has made the short term charts of little use. It is almost pure folly to attempt to make trading decisions based on them. Buy and hold then? It works great until it doesn’t. That is to say when the market doesn’t turn around and keeps moving lower. So how do you deal with it? The only way you can…..which is to utilize charts using a longer time frame. What do I mean by longer? 50, 100, and 200 day moving averages. Nothing less than 50. Ditch the 20, 10, and 5 EMA’s. The market makers will eat your lunch if you use them for anything other than a quick reference point. What are the negative aspects of using a longer timeframe? Yes, there are ups and downs to using anything. Quite simply this, when the market turns you will often sit and watch the initial move higher or lower until your indicators move enough to confirm a longer term trend. Remember, our strategy is to follow the trend, not to time the market. I know that some of recent moves have been pretty timely but timing was not our focus or intention. So what about the market turn? What about performance lost or gained during that time? Here’s the way to look at that. You all buy insurance for you house and car, correct? You pay for that insurance with money out of your checking account. Once you spend that money it is gone. So what do you get for your money???? You get protection. You get protection whether you use it or not. How many times do you actually use your insurance on the street. It’s not like you have a car accident or catastrophic incident with your house every month when you pay for the insurance. So is that money lost? A lot of folks on the internet seem to think so. Recently when we sold and moved to the G Fund at the beginning of the month, there were a few folks that said we should have moved quicker, that we had no emphasis on loss prevention. Really, are you kidding me? The market lost nearly 7% in two days and triggered numerous sell signals. Hey folks, when the market moves quickly then so do the charts!! I don’t care what percentage you had invested you felt that sell off. It affected buy and holders, swing traders, market trenders and everyone else. So we sold and got out with just a little more than we began July with, but we did in fact end up with a little more than we had. So what were we supposed to do? Stick around and see if that sell off generated a real, sure enough, loss??? Sure the market came back. That’s easy for those folks to say looking back. Hindsight is 20/20 right? Well, let me briefly get back to our insurance analogy. We paid an insurance premium that insured us against a catastrophic loss. We didn’t end up needing it but it was there. While there aren’t many guarantees in this world I can without a doubt guarantee you that we were not going to lose what we started the month of July with. Could they have guaranteed the same? I think not. Loss prevention means different things to different people. I think to those folks it means that you invest less in equities as you get closer to retirement. Kind of like a Lifecycle type thing. Just get into an L Fund they say. I disagree with that. Not just a little bit but totally! If you invest less then you make less. I would argue that we had more to give up at the end of July because we were completely invested while the market was moving higher. Folks, you have to be in it to win it. So what does loss prevention mean to us? Not losing! Not losing our principle!! Yes, staying at your portfolios highs everyday of the year would be ideal. It would be a pie in the sky wouldn’t it? Only in a perfect world could you achieve that while your invested. Show me an L Fund that stayed at it’s high through that sell off? Well how many are there?? Zero, that’s how many. So I’ll tell our critics this. Don’t throw rocks if you live in a glass house. Now let me tell you what I think is irresponsible. To leave your money in an L fund or any other investment scheme and let it fall each time with the market. Just remember one thing. If you were invested in an L Fund you didn’t make any extra money in the first place. Sure your balance dropped less but did you take the time to count the money that you never made in the first place? The bottom line is that you have to be invested to make money. You have to be out of the market to avoid losses. Those of you who are critics of our strategy can’t have your cake and eat it too. Classic Wallstreet loss prevention limits your losses but more importantly it limits your gains. You see, they will never tell you that. What is our philosophy here? We believe in being invested as much as possible, but we more strongly believe that by keeping more of what we already have, we will have more in the end. So…..”It’s not what you make that’s important. It’s what you keep!” There are many ways to approach investing. This is how we do it and we only had one really bad year out of the last 28. I’ll take that any day of the week. Let me add one more thing on this subject. The most imp0rtant thing. We seek God’s guidance in everything we do. We trust in Him to guide our hand. Without that no system will succeed…….. Oh yeah, and one more thing to our critics. SELL IS NOT A DIRTY WORD!!!
Speaking of market making events, here is what we have on tap for this week.
Monday
Economic data: Leading Index, July (-0.3% expected, -0.2% prior)
Earnings: Estee Lauder (EL), Palo Alto Network (PANW)
Tuesday
Economic data: Philadelphia Fed Non-Manufacturing Activity, August (-19.1 prior)
Earnings: Lowe’s (LOW), XPeng (XPEV), Toll Brothers (TOL)
Wednesday
Economic data: MBA mortgage applications, week ending Aug. 16, (+16.8% prior); FOMC meeting minutes, July
Earnings: Macy’s (M), Target (TGT), TJX (TJX), Snowflake (SNOW), Synopsys (SNPS), Urban Outfitters (URBN), Zoom (ZM)
Thursday
Economic data: Initial jobless claims, week ending Aug. 17 (227,00 previously); S&P Global US manufacturing PMI, August preliminary (49.6 prior); S&P Global US services PMI, August preliminary (55 prior); S&P Global US composite PMI, August preliminary (54.3 prior); Existing home sales, month-over-month, July (+0.3% expected, -5.4% prior)
Earnings: Advance AutoParts (AAP), BJs (BJ), Cava (CAVA), Intuit (INTU), Peloton (PTON), Red Robin (RRGB), Ross Stores (ROST), Viking Therapeutics (VKTX), Workday (WDAY)
Friday
Economic data: New home sales month-over-month, July (+2.6% expected, -0.6% prior); Kansas City Fed services activity, August (-4 prior)
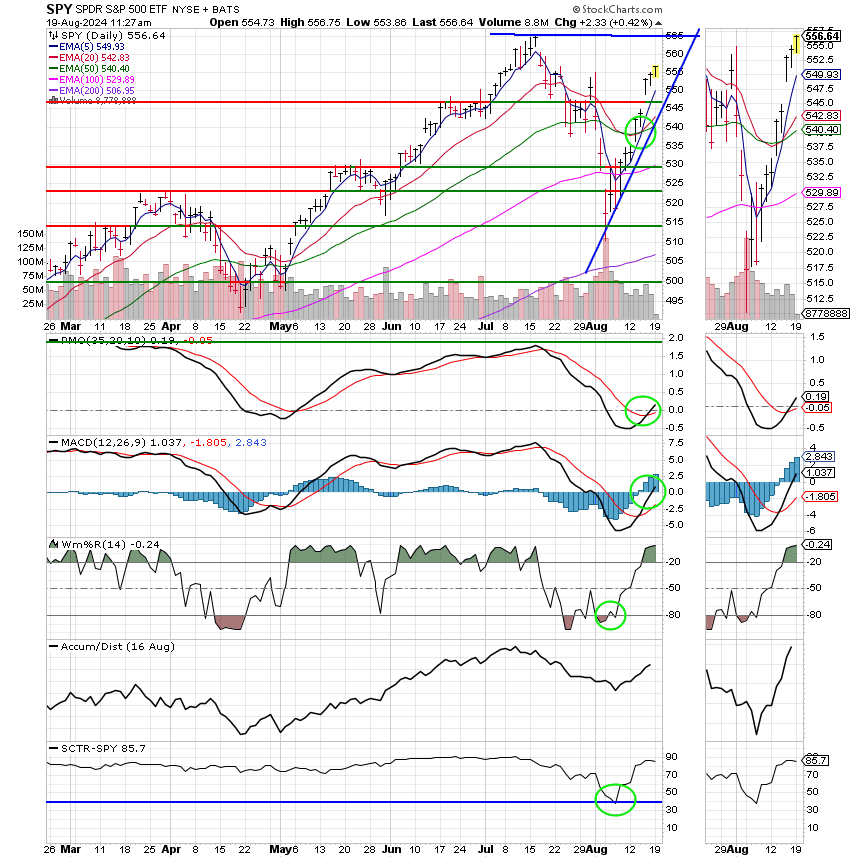
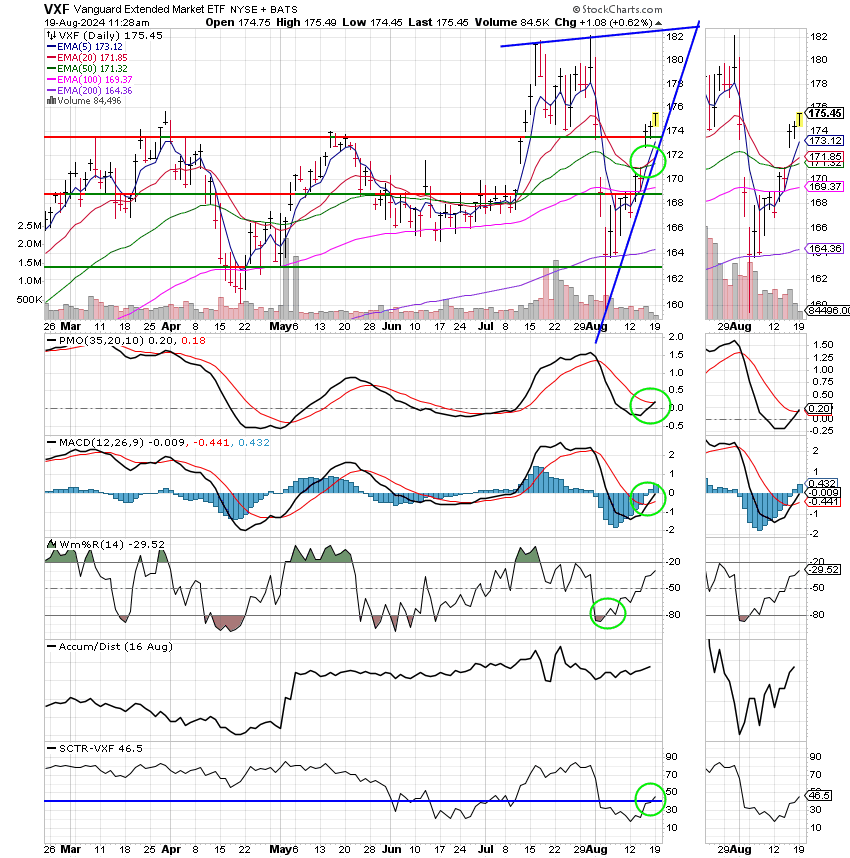
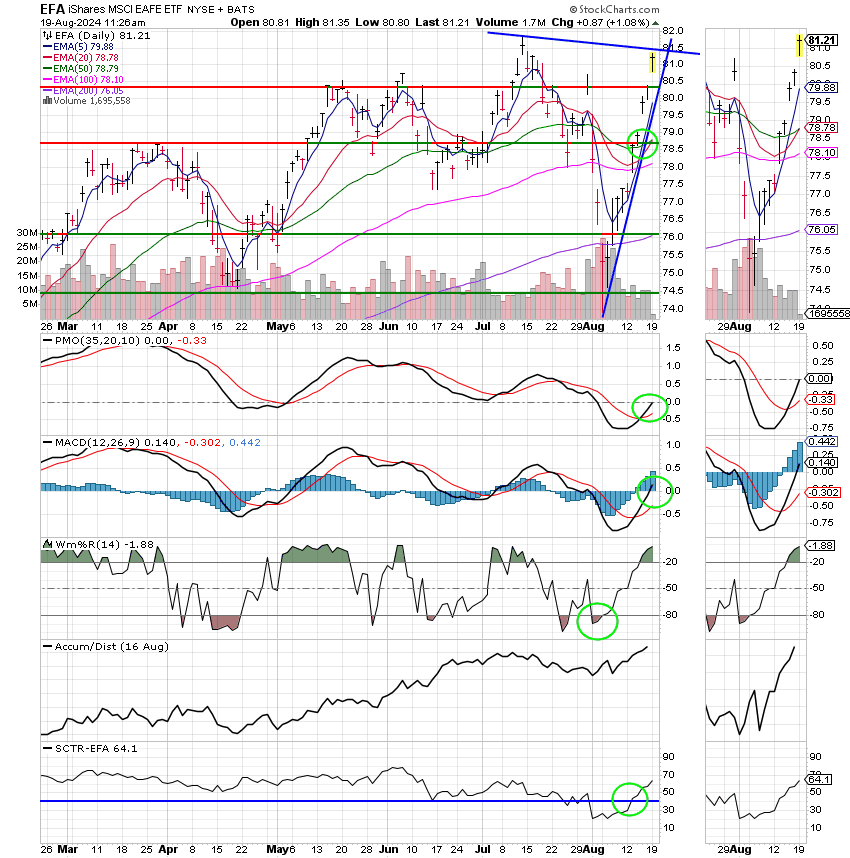
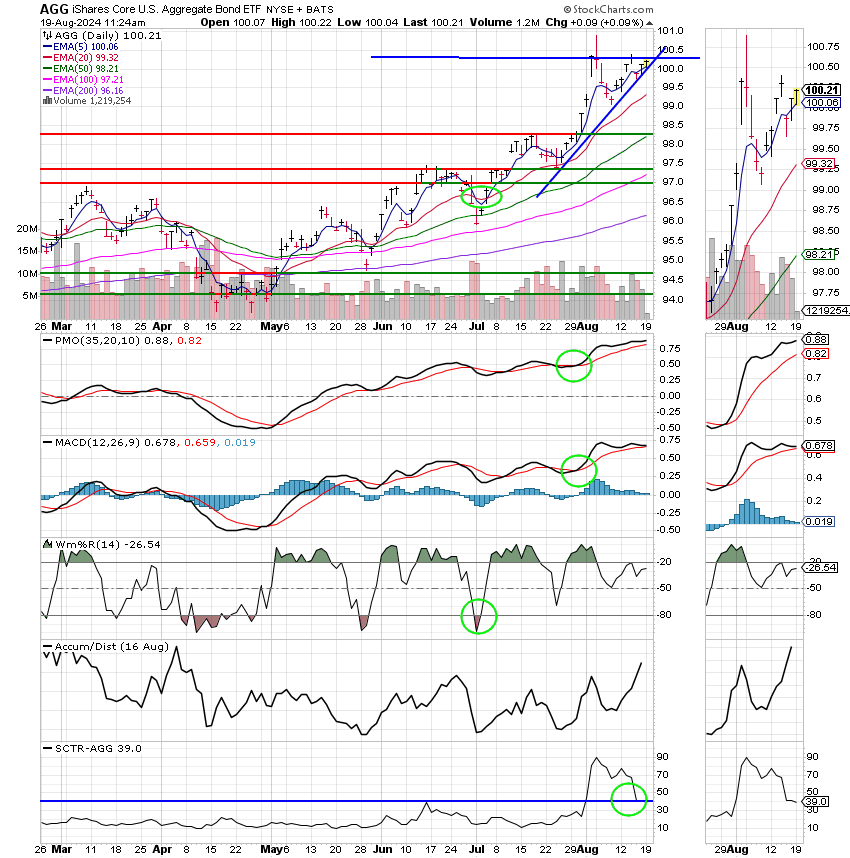
Our strategy remains the same. We think the Fed will begin reducing rates in the beginning of September and we want to be invested in equities at that time if at all possible. Of course we will watch our charts closely and do what they say and should they say to sell again, then we will do so. No panic, just routine business.
The days trading so far has left us with the following results: Our TSP allotment is in the green at +0.38%. For comparison the Dow is up +0.49%, the Nasdaq +0.34%, and the S&P 500 +0.38%. It looks like it’s going to be another good day. Praise God for that!
Dow rises nearly 200 points as recovery rally picks up again: Live updates
The recent action has generated the following signals: C-Buy, S-Buy, I-Buy, F-Buy. We are currently invested at 100/C. Our allocation is now +8.45% on the year not including the days results: Here are the latest posted results:
| 08/16/24 | Prior Prices | ||||
| Fund | G Fund | F Fund | C Fund | S Fund | I Fund |
| Price | 18.4647 | 19.7974 | 87.3393 | 82.261 | 43.7532 |
| $ Change | 0.0021 | 0.0398 | 0.1857 | 0.1949 | 0.2662 |
| % Change day | +0.01% | +0.20% | +0.21% | +0.24% | +0.61% |
| % Change week | +0.08% | +0.53% | +3.99% | +3.38% | +3.88% |
| % Change month | +0.18% | +1.28% | +0.66% | -2.74% | +0.01% |
| % Change year | +2.79% | +2.99% | +17.45% | +6.70% | +8.89% |


