
Good Evening, My what a difference a few days can make. The market was heading up Friday but did a U turn and finished the day down after Janet Yellen strengthened the case for a rate hike possibly as early as September. It seemed that doom and gloom had once again set it. But wait, not to be disappointed! On Monday stocks rose out of the gate after a favorable report on consumer spending. As investors took a closer look at things they decided that perhaps the economy was indeed getting stronger as Janet Yellen had suggested. I have always said that hiking rates wasn’t the issue, but the frequency of the suggested rate hikes was. Say we have one possibly even two rate hikes before the end of the year. We would still be at historically low rates. Also consider the flip side. An economy that can support a rate hike is getting stronger. After all, isn’t a stronger economy good??? Of course you are always going to have the bears saying that the FED doesn’t know what they are doing. They will even point to the Fed’s last rate hike in December as an example. The consensus now is that it was too early and caused a negative effect on the economy and the markets. I guess we’ll just have to wait and see. Nonetheless, today was good and that is what we are dealing with now. The precious present.
The days trading left us with the following results: Our TSP allotment gained +0.28%. For comparison, the Dow added +0.58%, the Nasdaq +0.26%, and the S&P 500 +0.52%.
Wall St. gains as data points to budding economy
The days action left us with the following signals: C-Neutral, S-Neutral, I-Neutral, F-Neutral. I’m not sure I can remember the market trading in such a tight range for so long. These neutral signals are a result of this range. Our TSP allocation is now +1.47% on the year not including the day’s gains. Here are the latest posted results.
| 08/26/16 | Prior Prices | ||||
| Fund | G Fund | F Fund | C Fund | S Fund | I Fund |
| Price | 15.0893 | 17.9228 | 29.6859 | 38.3379 | 24.5085 |
| $ Change | 0.0006 | -0.0477 | -0.0463 | -0.0940 | -0.1918 |
| % Change day | +0.00% | -0.27% | -0.16% | -0.24% | -0.78% |
| % Change week | +0.03% | -0.15% | -0.66% | -0.09% | -0.62% |
| % Change month | +0.11% | -0.44% | +0.01% | +0.50% | +0.25% |
| % Change year | +1.17% | +5.71% | +7.71% | +8.80% | +1.72% |
| L INC | L 2020 | L 2030 | L 2040 | L 2050 | |
| Price | 18.2278 | 24.0849 | 26.2564 | 27.9673 | 15.871 |
| $ Change | -0.0153 | -0.0408 | -0.0631 | -0.0778 | -0.0494 |
| % Change day | -0.08% | -0.17% | -0.24% | -0.28% | -0.31% |
| % Change week | -0.10% | -0.24% | -0.36% | -0.41% | -0.46% |
| % Change month | +0.08% | +0.10% | +0.11% | +0.12% | +0.14% |
| % Change year | +2.56% | +3.78% | +4.76% | +5.25% | +5.62% |
Now lets take a look at the charts. All signals are annotated with green circles. If you click on the charts they will become larger.
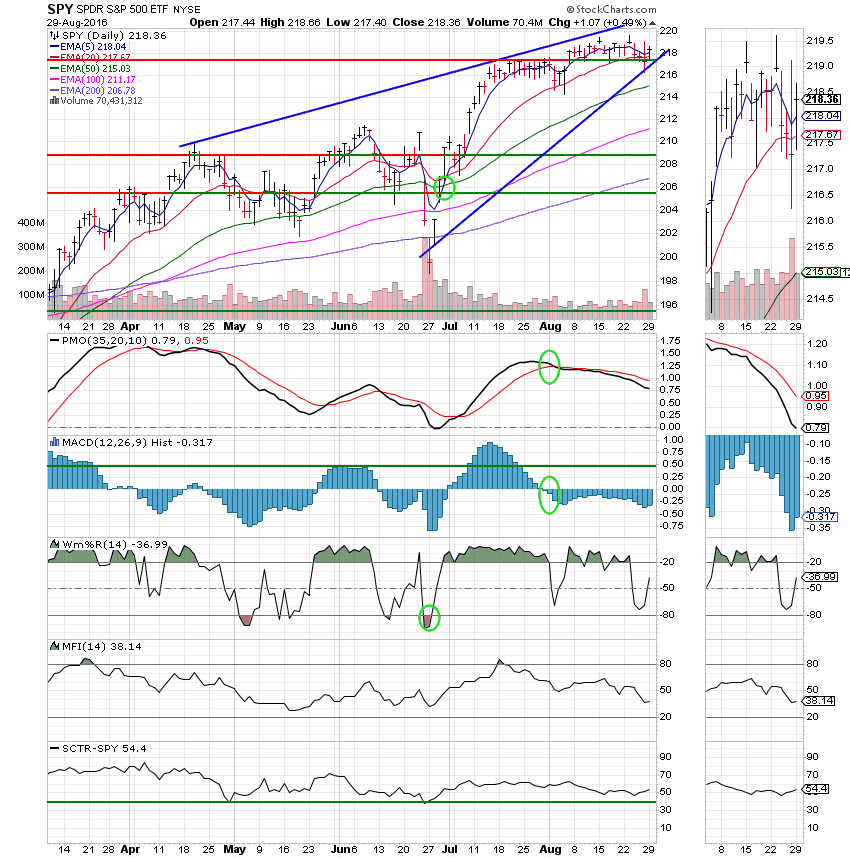
C Fund: Moving sideways just above support at 217.50.
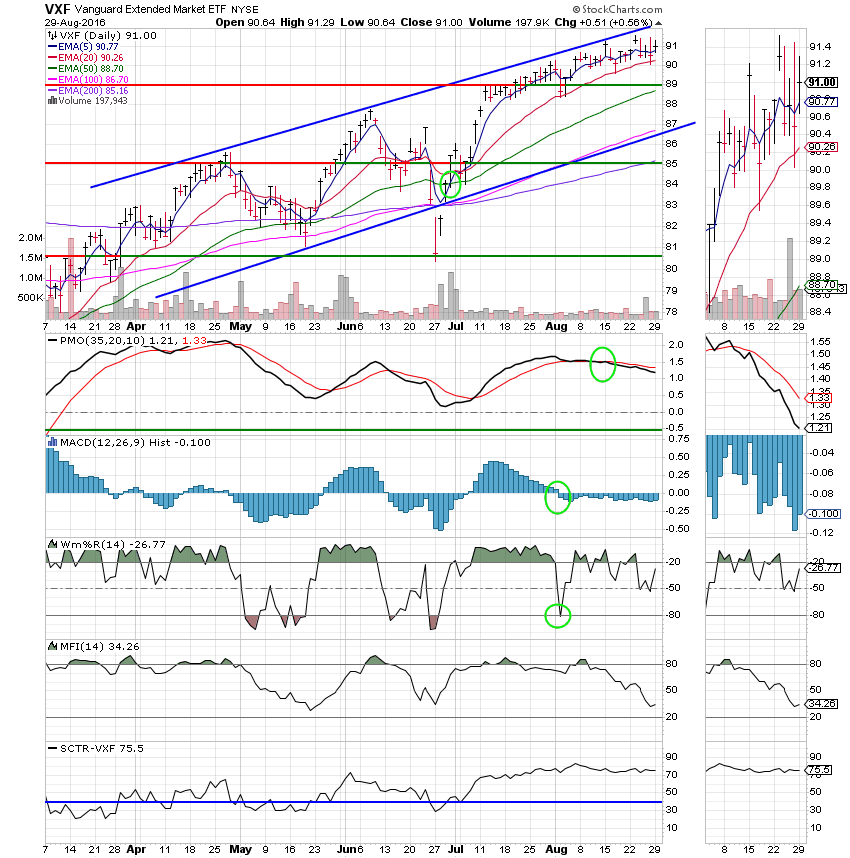
S Fund: Following the upper trend line. The SCTR of 75.5 is currently the best of all the TSP Funds.
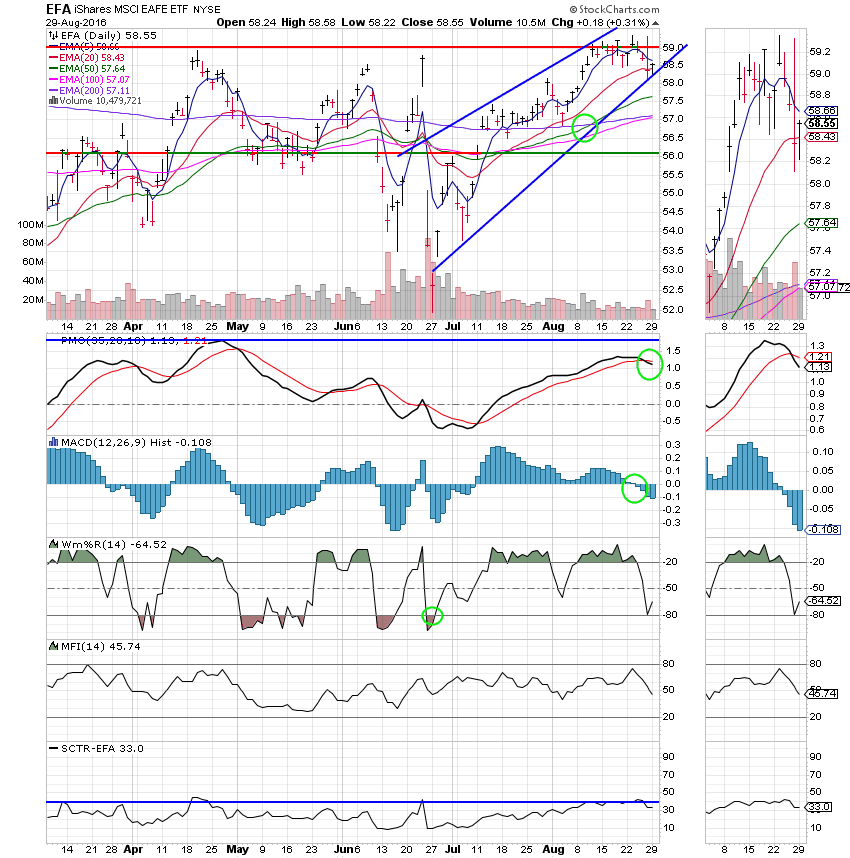
I Fund: The I Fund had a negative crossover of the signal line in the PMO to go with the MACD that’s already in negative configuration generating an overall Neutral signal. In our system we rate a chart neutral if two or more indicators are in negative configurations. It basically means that the chart could go either way. Buy or Sell.
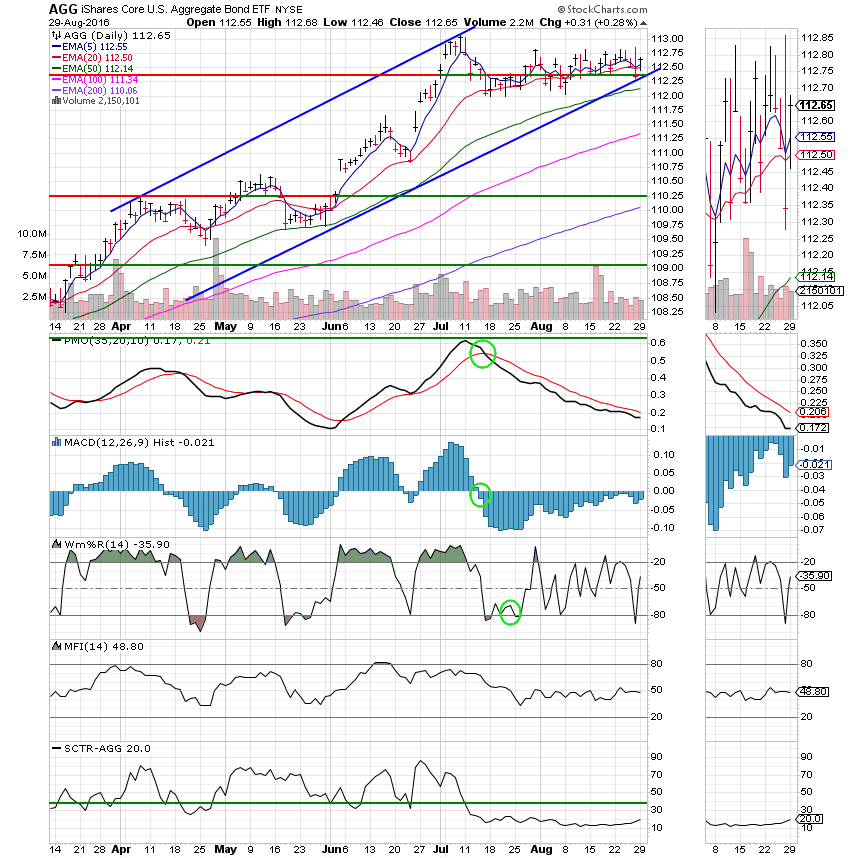
F Fund: Continues to move sideways just above support at 112.30.
It would be nice to get back into equities, but we need a pullback, not just consolidation to do so. The charts for the C. S, and I funds are simply too extended for a good entry at this time. A downturn after a poorly timed entry could easily put things in the red for the rest of the year. We must be patient and look for a better entry point at a better seasonal time. For now it’s better to be safe than sorry. Keep praying for His guidance and watch the charts. Then you’ll be ready when the right time comes to make a change. That’s all for tonight. Have a nice evening.