Good Day,
I’m putting out a short message today since I missed Friday’s market recap. I was on the road pursuing my “other hobby” of college football. I took my laptop with the idea of putting out a newsletter on Friday evening, but the internet coverage was having trouble at my friends home so laptop or not, it wasn’t going to happen. I was able to check the day’s results on my phone, but have basically sworn off of doing news letters from that platform as it’s just too difficult to assemble the information necessary to complete the message. Of course, the newsletter is a snapshot of what I look at each day to assess the health of the market and make my investment decisions. There is a myriad of investment information that you can read, but it is impossible to read it all each day, so what I do is to have a basic routine of scanning information that will give me a snapshot of each day’s market action. This gives me a baseline to determine where I am at and where I am going. It is very important to be aware of this information on a daily basis. I then utilize the rest of my time to read various articles about information that is of interest, but may not necessarily determine what is happening today. For instance, it may be of passing interest what Warren Buffet is currently investing in, but is really chasing a rabbit when it comes to information that I need to assess the overall health and direction of the market on a daily basis. Also worth noting on this subject is that I examine several charts each day which are impossible to post in their entirety due to their sheer volume. While it is necessary to know what’s going on in the market, the information is of little value to me without my charts, as technical analysis is the basis for all my market decisions.
The market Friday declined in the early going but picked up in the afternoon. Breadth was good but volume was slow reflecting the general lack of interest due to the Labor Day holiday. It appears that both stocks and bonds are extended heading into what is traditionally the worst market month of the year. We will continue to look for a pullback and should it come, will exit the equity market in the hopes of finding a good post-dip entry point in October or November. That is, if the market will cooperate. So far it has been oblivious to all the world turmoil such as the constant headlines about ISIS and Ukraine, but one has to believe that those issues will eventually come to play at some point. Of interest this up coming week is the ECU Central Bank meeting. It is widely expected that European Bank Chief Mario Draghi will announce a European version of Quantitative Easing (Stimulus) as the economic situation there, which was not ideal to start with, is deteriorating somewhat as a result of sanctions in place against Russia for its intervention in Ukraine. This situation bears watching as it will tell us what we may expect to see on our charts in coming days. I have a sneaking suspicion that this news is fueling the bond market which appears to be extended as traders continue to seek them as a safe haven from this negative news. Should the ECB fail to introduce stimulus, the European economy will most surely suffer further deterioration which will ultimately effect our markets here. The chart for the I Fund which tracks foreign markets has never fully recovered from the recent down turn and is still giving a neutral signal. It may well foreshadow things to come here.
The bottom line is this: We need to stay where we’re at, but additionally, we must stay vigilant as there are several land mines out there that can effect both stocks and bonds. There are scenarios out there that could require us to go to 100/G at some point. Of course that would be cash on the street. In other words, so far so good. Just don’t get so comfortable that you put it on cruise!
Now just a few monthly figures on TSP and AMP. Our TSP allocation closed out the month with a gain of +3.13% and the AMP Program had a gain of +2.12%. AMP is way ahead of TSP at this point so we can afford to be a little more conservative there given the better defensive investments that are available in that program.
Historically (50-60 years), September has been the weakest month of the year, but this 30-year September Seasonality chart shows a fairly good start with some mid-month hiccups. Nothing too concerning, except that September is even worst during mid-term elections years. Another “but”… But in the last mid-term year 2010, September did great.

Chart provided courtesy of www.sentimentrader.com
, analysis by TSP Talk
Friday’s action left us with the following signals: C-Buy, S-Buy, I-Neutral, F-Buy. Our allocation is now -3.08% for the year. Here are the latest posted results:
| 08/29/14 |
|
|
|
|
| Fund |
G Fund |
F Fund |
C Fund |
S Fund |
I Fund |
| Price |
14.5109 |
16.5824 |
26.2491 |
35.8987 |
26.2962 |
| $ Change |
0.0028 |
0.0013 |
0.0889 |
0.2078 |
0.0252 |
| % Change day |
+0.02% |
+0.01% |
+0.34% |
+0.58% |
+0.10% |
| % Change week |
+0.06% |
+0.38% |
+0.80% |
+1.12% |
+0.62% |
| % Change month |
+0.20% |
+1.12% |
+4.01% |
+4.98% |
-0.14% |
| % Change year |
+1.57% |
+5.34% |
+9.94% |
+6.62% |
+2.86% |
|
L INC |
L 2020 |
L 2030 |
L 2040 |
L 2050 |
| Price |
17.3287 |
22.8451 |
24.7831 |
26.3748 |
14.9962 |
| $ Change |
0.0136 |
0.0381 |
0.0529 |
0.0657 |
0.0414 |
| % Change day |
+0.08% |
+0.17% |
+0.21% |
+0.25% |
+0.28% |
| % Change week |
+0.23% |
+0.46% |
+0.57% |
+0.65% |
+0.72% |
| % Change month |
+0.84% |
+1.64% |
+2.07% |
+2.40% |
+2.61% |
| % Change year |
+3.05% |
+4.81% |
+5.64% |
+6.20% |
+6.63% |
|
The I Fund is still lagging reflecting the poor economy in Europe and the economic struggles in Japan.
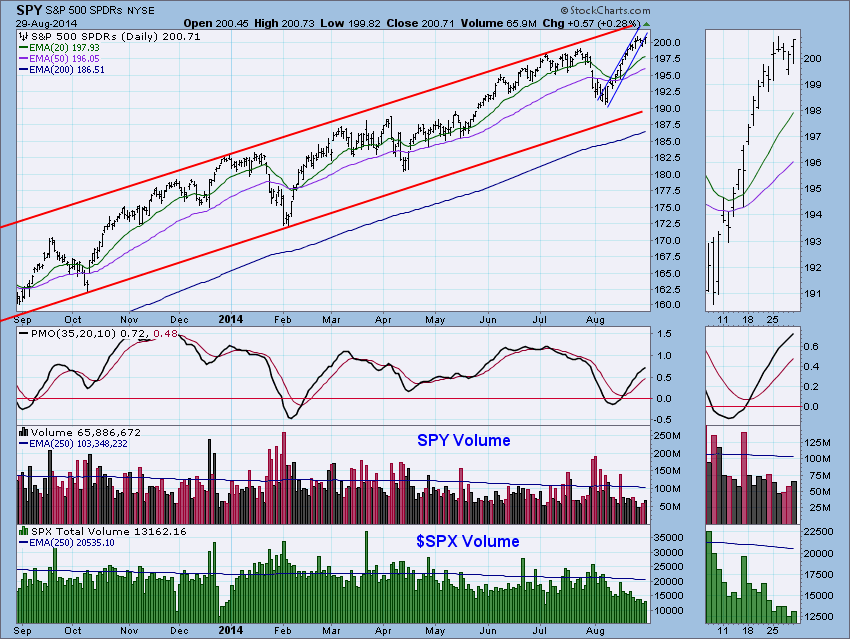
Here’s the SPY. Charts courtesy of stockcharts.com with analysis by Erin Heim of DecisionPoint.
“We see that price broke below the very steep short-term rising trend channel. Looking at the thumbnail, we can see the consolidation the market has been experiencing this week. Volume is still very low because of the upcoming holiday.”
“The weekly chart shows us that as price has been rising, it is still being contained in the rising trend channel. It tapped the top last week and it did the same this week. The weekly PMO turned up earlier this month, but because of the flat noisy PMO , I think it should be considered a shorter-term indicator for this weekly chart.”
“The monthly chart shows that support is holding nicely with price managing to stay above the rising trend channel after testing it this week.”
“Conclusion: The market spent the week mostly consolidating the large rally that seemed would never end. However, now that our indicators in all three time frames have turned bullish, the pause might be over. Short-term indicators are in neutral territory, not oversold, so its bullish configuration and a new rally may not last long.”
Her analysis is correct. Now I’ll add my 2 cents to the pot. It is probable that based on the extended nature of the charts we will have another significant pullback after this short rally. I am basing this on my observation of the charts. Of course, that is one major news event from a change, which is why we don’t put much stock in prognostication. Not that it can not be accurately done, because it can, but everything has to fall in line. Think of it as the ten day forecast on the weather channel. It is constantly revised as the day becomes closer. Prognostication should be considered more as a wind sock to determine which direction the market wind is blowing. That is the reason that we read our charts. Right now we will stay put in TSP and AMP and wait for the market to make its next move. That’s all for today. God bless and go eat some barbecue!
Scott