
Good Morning,
This is the Nasdaq Index Chart.
The week at the end of September was building the bottom. The weekly reversal line has pressure from top in September. The weekly reversal lines are similar in March and September; however, the breather indicator in September was not extreme like March. There was consolidation in September, but the black swan bearish in March.
The week at the end of September was building the bottom. The weekly reversal line has pressure from top in September. The weekly reversal lines are similar in March and September; however, the breather indicator in September was not extreme like March. There was consolidation in September, but the black swan bearish in March.

Weekly KD has golden cross.
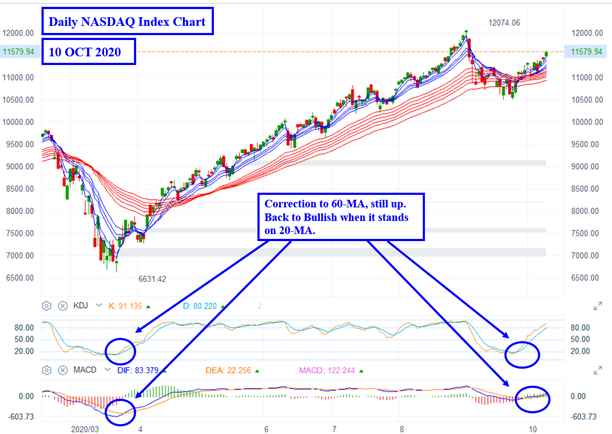
The chart above, we can definitely see that, where all the red and blue lines are converging. Nothing like the crosses in February and April. It stands on 20-MA, that is bullish. It will be interesting to see the breakout as the pressure is building.
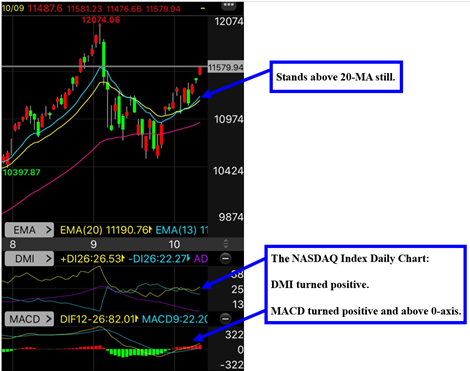
DMI turned positive in NASDAQ Daily chart.
MACD now is above 0-Axis.
Also to consider….
It is still hard to say… my charts are only the reference…
Not sure if we have another black swan in this election…
The weekly reversal line will be on top in November which will bring pressure..
Have a great day! Wayne