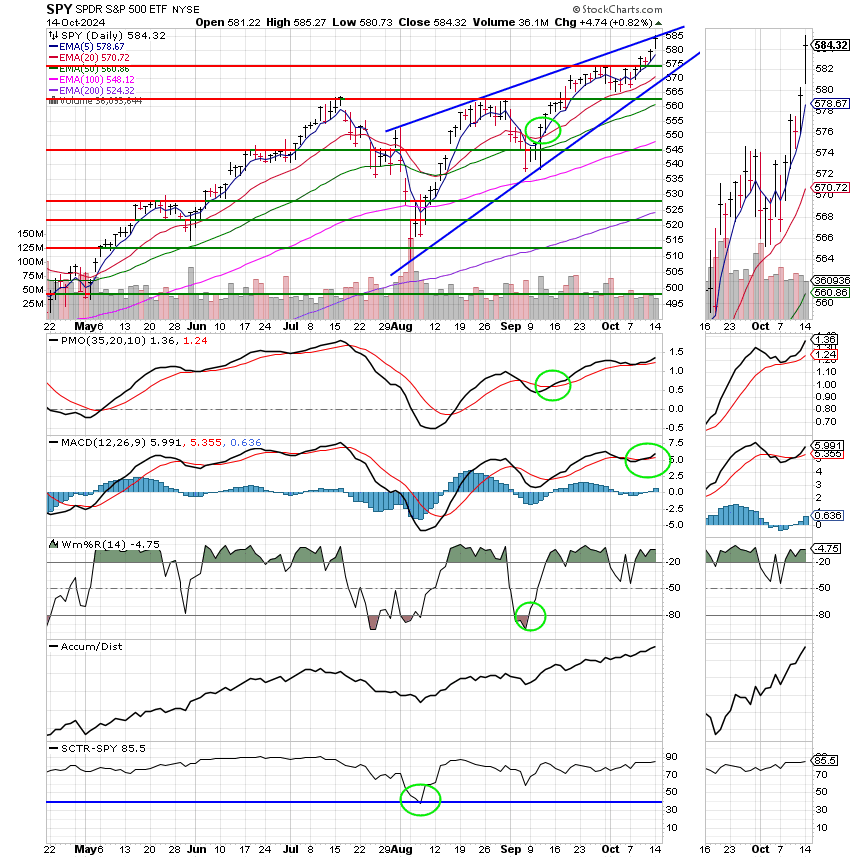
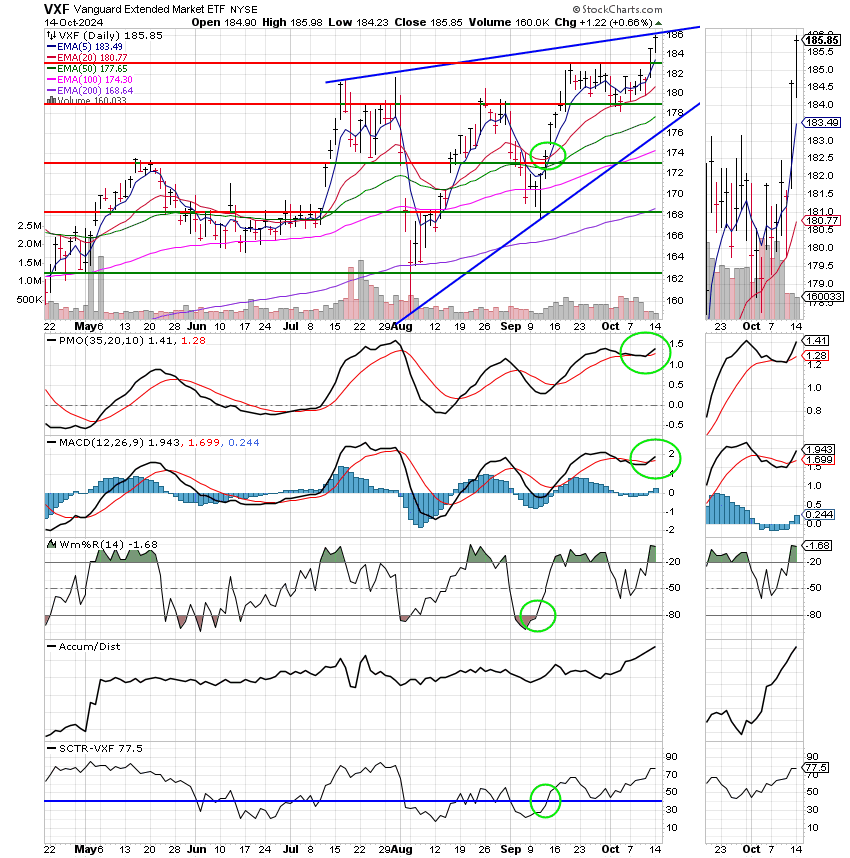
Good Evening, The S&P hit another record and we were in it. Praise God for that! We can definitely feel good about that but we must never relax and lose sight of the fact that this is a volatile mix. Not that it hasn’t been volatile since the pandemic but it’s even more so right now. You have an injection of volatility from the Presidential Election and the war in the middle east balance by earnings growth, a likely soft landing for the economy, and lowering interest rates. You can take the lower interest rate environment alone and make a good case for just staying invested in equities. When I first started investing during the Jurassic Period LOL (a long time ago) that would have been enough for me, but not now. If there is a chance the market will dip 5 percent or more I’m all about trying to profit from it. Once I developed a style and learned to trade I have always tried to make as much profit as I can. I’ve been doing this long enough that I can accurately predict the questions I will get. It’s actually pretty easy. There will be some folks that will send me a message or comment on our Facebook page that we are only up about 13% and the S&P 500 is up in the neighborhood of 23%. It would be better to just stay invested in the C Fund. Okay, we’ve been over this before and we’ll address it yet again. If you want to know the whole detailed story of what we did and how we did it during 2022 and 2023 you can go back and read those blogs in the archives. However for now I will give you a quick recap. The market changed heading into the pandemic and after the pandemic. The system we used for the past 25 years quit working and I mean almost abruptly. So we spent that period of time figuring out exactly what was happening and developed a new system. We had the system complete and in place by January 1st 2024. However, as good as it was it took us another 6-7 months to learn how to use it effectively. The result is that we pretty much broke even during that time while the C Fund gained about 15%. I remember it now like it was yesterday. I had one or two folks that have been with me a good while that expressed doubt as to whether or not the new system could perform as well or better than the market. The system performed well heading into August and we were able to rack up some really nice gains only to lose most of all of them during a big sell off during the first week. The market dropped some 7 percent in just three days. As I previously wrote, we received a signal from one of our new indicators one day before the sell off began. Had we acted on it we would have kept all of our gains to that point rather than the very small amount we were able to save. So we learned our last lesson about the new indicators and that is to pay special attention to the early ones. Initially, we didn’t know whether to trust the early signals or not, but now we know that we can. The end result is that we have performed as well as the C Fund. We just had to get used to driving the new car so to speak. Since the end of July we have made 7%. During that time the S&P made the same 7 percent. So we matched it and given enough time we’ll best it. Remember, we left 7% on the table back in the beginning of August. As one of out members pointed out, we always used to beat the C Fund, but we’re not doing it now. Well we matched it since we got the new system up and running and were only one trade or 3 days from doubling it. Good things come to those that are persistent! We will continue to get better and better at running it. There is still a lot of untapped potential here. Getting back to the market. Our strategy right now is to stay put in the C Fund until the election. At that time depending on who wins the election, we’ll take a look at the S Fund as it normally performs very well in November and December. Actually, I did have someone ask why we weren’t in it right now. We chose to invest in the C Fund as it has a lower beta than the S Fund which is the markets way of saying it’s less volatile. We feel like the market will settle down some after the election creating a much better environment for small caps. We’ll see, as it sits currently the C Fund has an SCTR of 85.5 and the S fund has an SCTR of 77.5. As you know the SCTR compares the chart to all the other charts in it’s universe and gives it a score from zero to a hundred. That means that the strength of the chart for the C Fund is 7 points higher than the chart for the S Fund. Therefore, you are likely to keep more of what you make with the higher SCTR. In my experience the SCTR is a good measure of the charts volatility. The higher the score the less volatile the chart. Now they don’t necessarily use it that way as it is intended to be a measure of the overall strength of the chart, but I am saying it has been my experience in almost every case that I will keep more of what I make while using the chart with the higher SCTR. The SCTR has been an extremely valuable indicator for me over the years. If you want to know more about it and other indicators you can read about them for free at the chart school at stockcharts.com .
The days trading left us with the following results: Our TSP allotment posted a nice gain of +0.82%. For comparison, the Dow added +0.50%, the Nasdaq +0.87%, and the S&P 500 was +0.82%. It was a good day. We’ll take the time to praise God for that!
Dow adds 200 points for first close above 43,000; S&P 500 hits another all-time high: Live updates
| 10/11/24 | Prior Prices | ||||
| Fund | G Fund | F Fund | C Fund | S Fund | I Fund |
| Price | 18.5792 | 19.8005 | 91.6272 | 87.371 | 44.7725 |
| $ Change | 0.0019 | -0.0022 | 0.5505 | 1.4956 | 0.1855 |
| % Change day | +0.01% | -0.01% | +0.60% | +1.74% | +0.42% |
| % Change week | +0.07% | -0.45% | +1.13% | +1.58% | -0.24% |
| % Change month | +0.12% | -1.45% | +0.96% | +1.47% | -1.54% |
| % Change year | +3.43% | +3.01% | +23.21% | +13.33% | +11.43% |
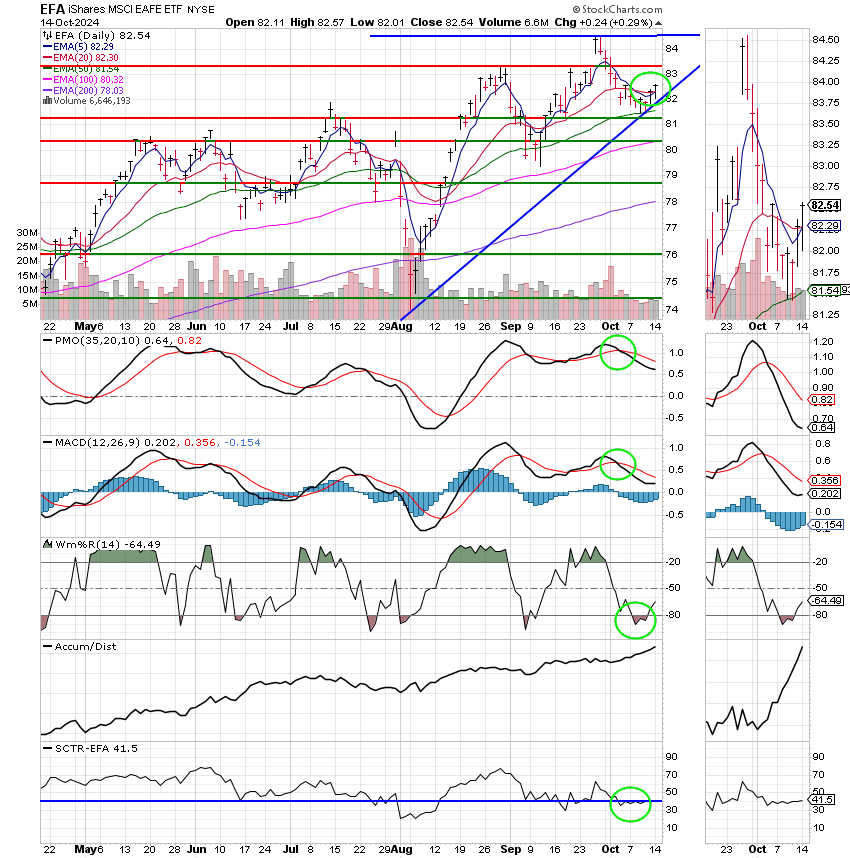
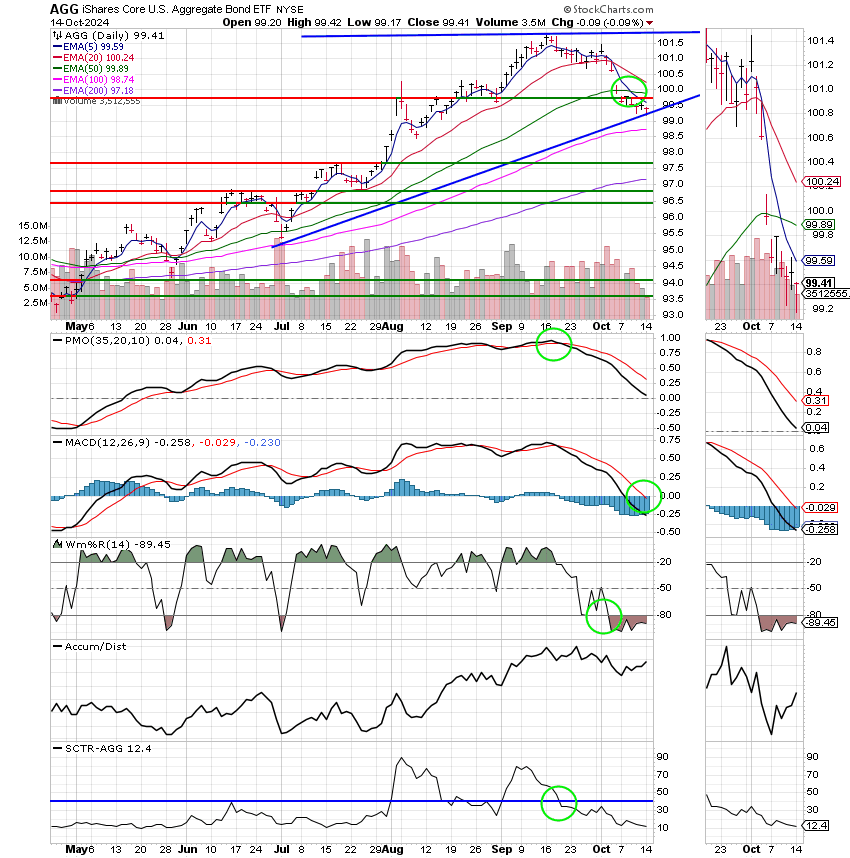
Now lets take a look at the charts. All signals are annotated with green circles. If you click on the charts they will become larger. If you want to learn more about technical analysis check out the website StockCharts.com.


