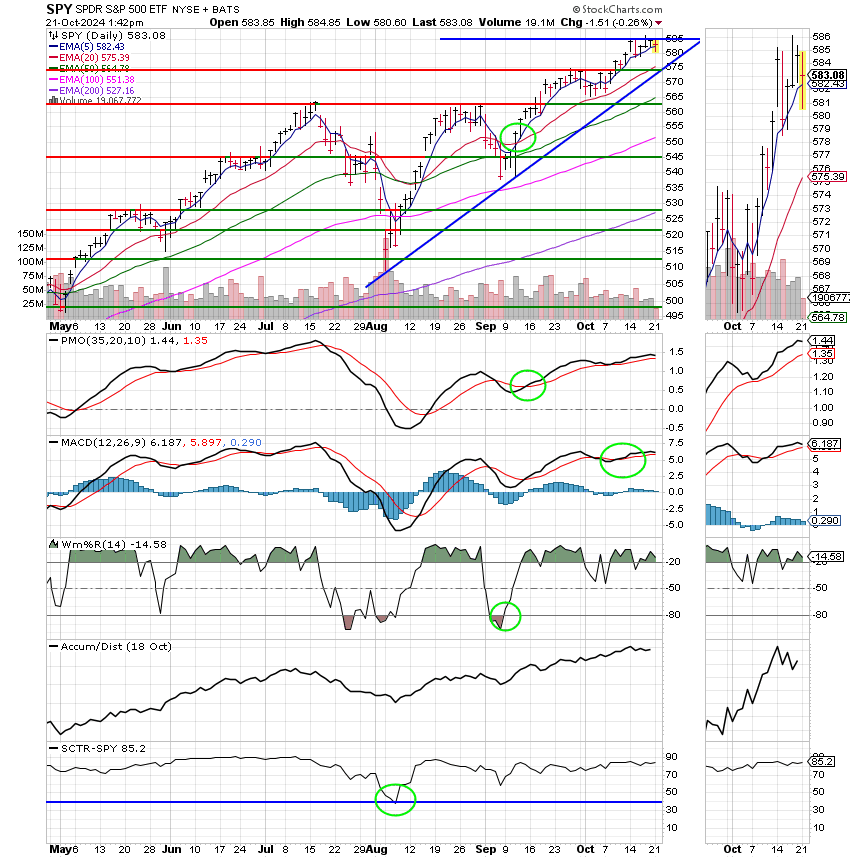
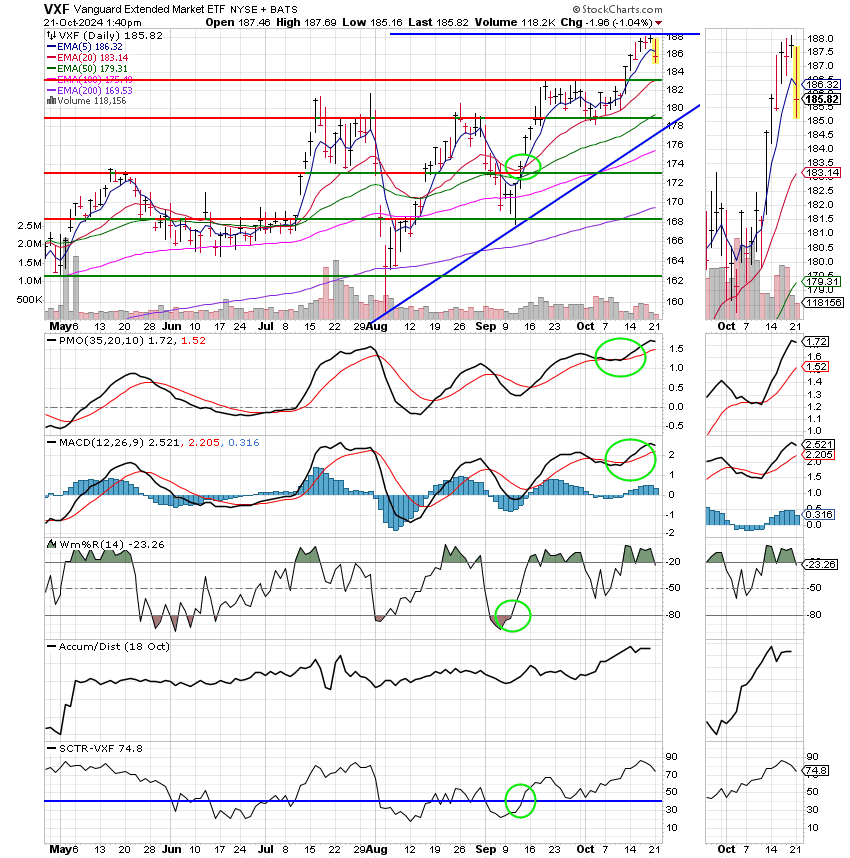
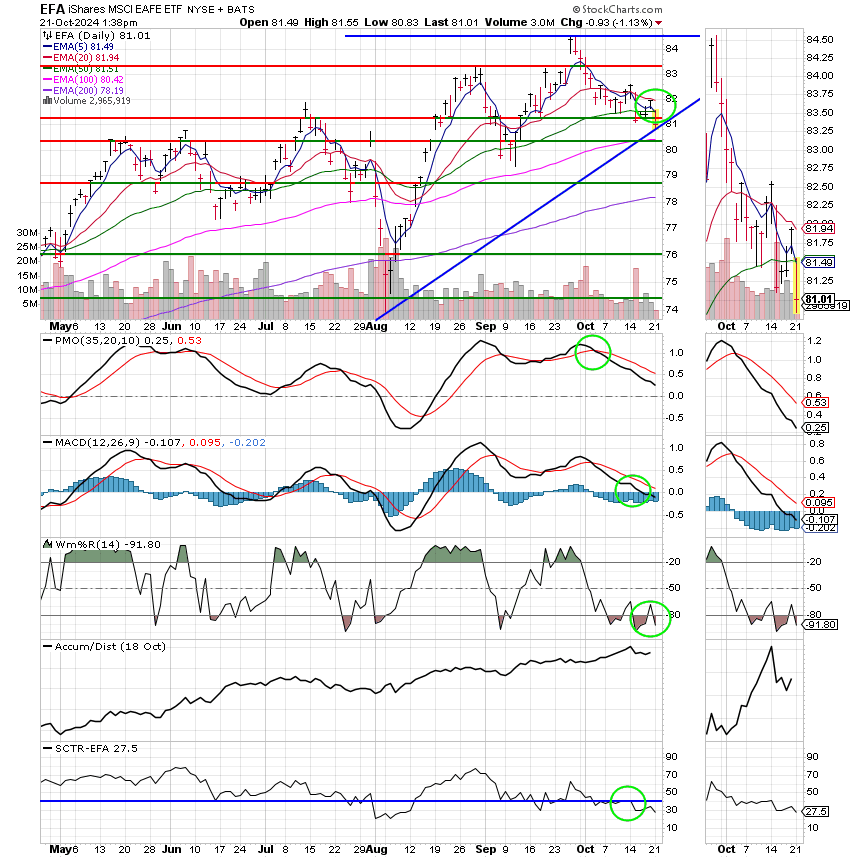
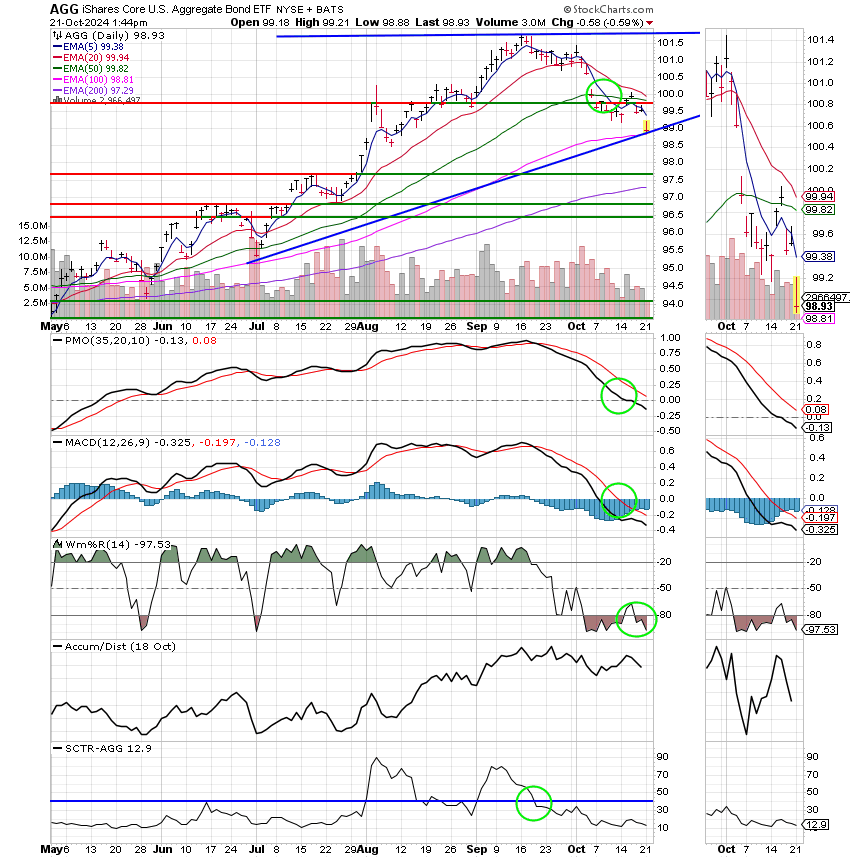
Good Morning, We’re getting closer to the end of October and closer to the US presidential election. Those issues are receiving the lions share of the market attention. Everything else is a side show. After all, the media has to have something to talk about, right? I could talk about all the things I’m reading about those issues on the internet. It’s simply crazy. It’s very difficult to differentiate between what’s AI generated, what’s false, and what’s actually true and it’s pretty much not worth the time to try to sort it all out. D0n’t get me wrong, it’s good to know what’s going on, but keeping up with current events isn’t what it was 30 years ago. Not even close. That’s the reason that the charts are more important now than they have ever been. Don’t blame them for the many trades that you have to make it the current market. That’s the product of volatility which is the result of uncertainty created by a lack of transparent news made even worse by a heavily contested presidential election coming on the tail of a post pandemic economic recovery. I know that’s a mouth full but it is what it is and that is uncertain. If there’s one thing I know beyond a shadow of a doubt it’s that the market hates uncertainty and uncertainty creates volatility. Will it get better after the election? That’s my hope but there’s far from any guarantees. The internet is supposed to bring information to us all instantly with a touch of a button and the flick of a wrist. Information??? I guess so. Accuracy and clarity? No and in some cases more like misguidance. Manipulation comes even more to mind . Folks don’t be surprised if I come in one day and stop talking about the news period, because I am totally frustrated with it all. Some of the AI generated content is extremely hard to tell from actual news. If you don’t know charting I suggest strongly that you take it up at least as hobby or stop investing one or the other. So back to the side show. This week the market is watching the current batch of quarterly reports closely with 1/5 of the S&P 500 reporting before the weeks end. So far approximately 79% of the companies that have reported have beaten estimates on the top and bottom lines. However, it could be argued that the bar was set very low so as to be easily overcome. That said, the reports while better than these low estimates have not exactly been stellar. Nonetheless, one would have to argue that is what should be expected since the Fed spent the past few years trying to slow the economy down in it’s battle with inflation. So right here and now the big issues are the are the US Presidential Election, Fed policy, and quarterly reports. Fundamentally speaking that is it. As far as the charts go….. as you know I look at many. What I am seeing this now is general weakening of most of the charts indicating that a pullback is probable in the near future. Yes, the market has been setting records, but each time it sets a new record the charts weaken just a little more. I believe that they will continue to rally until the major indices ultimately pull back. You can especially tell this by the closing gaps between prices and there 20 EMA’s on almost every chart you look at. Some are more pronounced than others. You can also see the gap starting to close on such highly watched indicators as the MACD, PMO, and RSI to name a few. Usually, if you see it in only one or two indicators you can ignore it, at least at that time, but when you see it on a lot of indicators and a lot of charts it’s time to take notice. This is that time. So do you move on this information? No, but you raise your vigilance and be prepared to sell in the event that those indicators move into a negative configuration. The charts are also calling for a short or shallow pullback. Again, you see this by looking at many charts and indicators. Not just one or two. You can measure the overall strength of the market by the position of the moving averages in Price. The shorter EMA’s are still over the longer EMA’s. In other words, the 5 is over the 10, the 10 is over the 20, the 20 is over the 50 and so forth and so on. You get the picture. Also, the moving averages of your major indicators such as the MACD and the PMO are holding over their zero axis. This it very important. Other indicators like the KDJ are also useful. If the J value remains above 50 then the market is strong. There are many many indicators that you can use in the same manner. Once you determine that the overall strength 0f the market is strong then you will know that any pullback will likely be shallow. Another thing is that it is more important to know how y0ur indicators behave in certain market conditions than it is to favor a particular indicator over another. That is why I encourage folks in our group to set up a chart with indicators that y0u understand and that work for you and stick with them. Watch them and learn what they do. I recommend that you go to the website stockcharts.com and utilize their free chart school to determine which ones will work for you and how they will work for you. As I mentioned above, I am starting to tire of all the fake and AI generated news. So I am going to be talking a lot more about charts and indicators and less about news. A lot less about news. I’m tired of wasting our collective time. You can read CNBC and Reuters as good as I can…..
The days trading so far has generated the following results: Our TSP allocation is trading lower at -0.29%. For comparison, the Dow is off at -0.68%, the Nasdaq -0.06%, and the S&P -0.29%.
Stocks slip Monday after S&P 500 and Dow post six-week winning streak: Live updates
The most recent action has generated the following signals: C-Buy, S-Buy, I-Sell, F-Sell. We are currently invested at 100/C. Our allocation is currently +12.53% on the year not including the day’s results. Here are the latest posted results:
| 10/18/24 | Prior Prices | ||||
| Fund | G Fund | F Fund | C Fund | S Fund | I Fund |
| Price | 18.5931 | 19.8101 | 92.4236 | 88.8655 | 44.7123 |
| $ Change | 0.0019 | 0.0098 | 0.3702 | 0.1685 | 0.2473 |
| % Change day | +0.01% | +0.05% | +0.40% | +0.19% | +0.56% |
| % Change week | +0.07% | +0.05% | +0.87% | +1.71% | -0.13% |
| % Change month | +0.19% | -1.40% | +1.84% | +3.21% | -1.67% |
| % Change year | +3.51% | +3.06% | +24.28% | +15.27% | +11.28% |
Nothing to add here. We just need to pay attention to our charts and never stop praying. That’s all for this week. Have a nice afternoon and may God continue to bless your trades.


