Good Evening, I had a pleasant fall day in Wears valley which is located next to the Great Smokey Mountain National Park today. So I’m getting to this a little later than usual. I would love it if I had someone to do this when I’m taking R&R, but I don’t. So mix pleasure and business I will…..There’s simply no rest for the weary. The market had a positive day today as it takes note of a busy week of earnings reports and prepares for next weeks election. Also, traders are watching a slew of key economic data this week, including a preliminary reading on third-quarter gross domestic product out on Wednesday; the September personal consumption expenditures, or PCE, price index, on expected Thursday; and the October jobs report due Friday. Add all that together and I won’t be surprised if it doesn’t get a little rough. Although, I must admit that today was a little calmer than I expected it to be. You can be sure though that this market is seeking the clarity that November 5th will bring. Then we will all know where this ship is sailing!
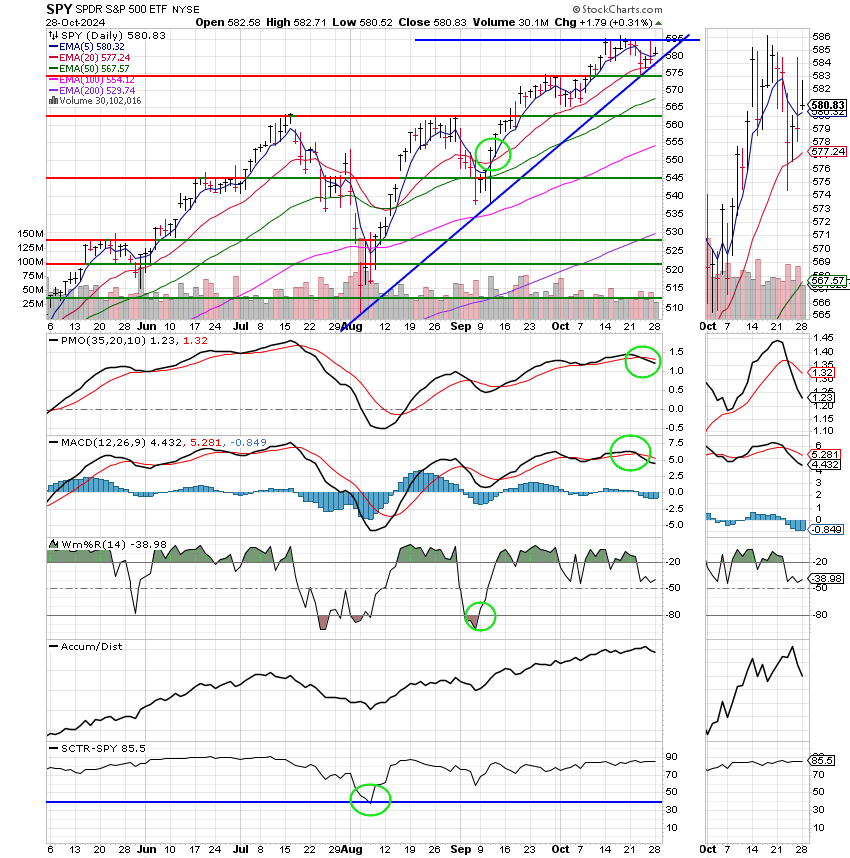
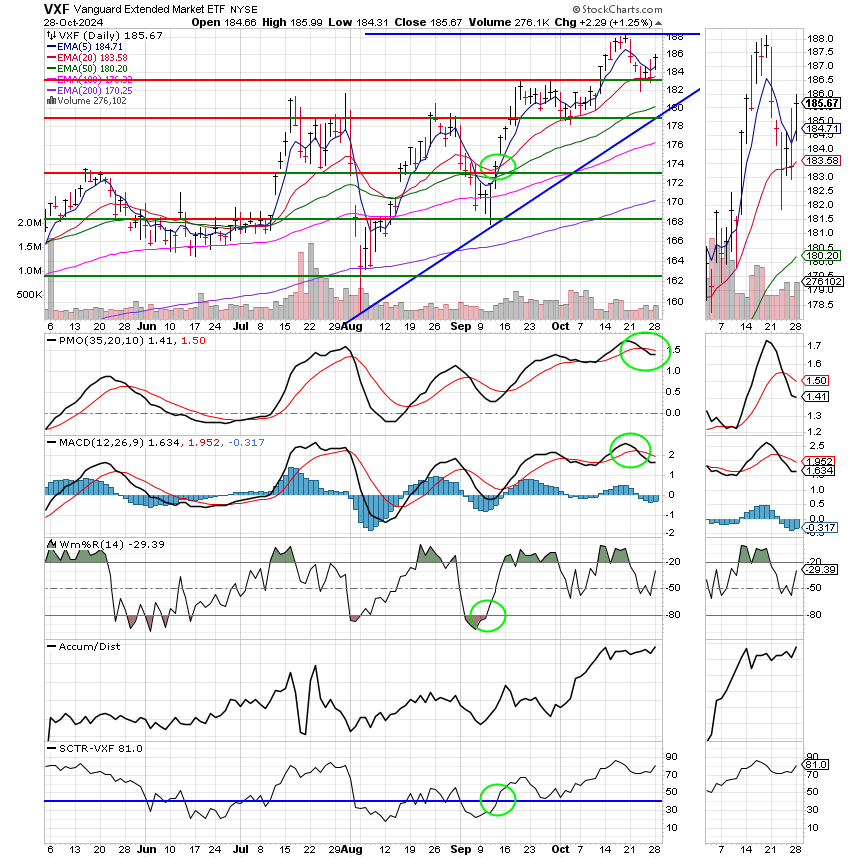
The charts continue to move somewhat sideways as the market seeks the above noted clarity. We are currently invested at 100/C. We rate the chart for the C Fund as a Hold. The EMA’s for both the PMO and MACD have both passed down though there signal lines resulting in this signal. However it should be noted that price remains above it’s 20 EMA and well within a bullish wedge pattern. Should this pattern execute by breaking above overhead resistance at 574 SPY the C Fund could move significantly higher. Our current target based on this pattern is in the 596 to 600 range. Of course that would be 5960 – 6000 for the S&P 500. One other thing we are watching closely is the S Fund. As you know it is made up of small and mid cap stocks. Small and midcaps tend to perform very well in the month of November. As expected the S Fund is starting to outperform a little bit. It’s chart is currently rated as hold because the The EMA’s for it’s PMO and MACD have also crossed down through their signal lines. The S Fund is also trading solidly within a bullish wedge. Should the pattern execute it too will move significantly higher. The difference between the two charts is the SCTR which is an overall rating using a basket full of stockchart.com’s indicators comparing a particular chart to all other stocks and ETF’s in it’s universe with a rating from 0 to 100%. Currently the SCTR for the C Fund is 85.5 and the SCTR for the S Fund is closing the gap at 81.0. Think of it as the overall strength of the charts based on a scale of 0-100. The C Fund is currently has a rating of 85.5% as compared to it’s competitors while the S Fund gets a grade of 81.0%. Should the S Fund become equal to or stronger than the C Fund we will move our allocation to the S Fund in November. Of course that’s provided that the chart has a buy signal. Either way it’s always good to have a plan. Please note that the charts are displayed below as usual;
The days trading left us with the following results: Our TSP allocation posted a gain of +0.31%. For comparison, the Dow was up +0.70%, the Nasdaq +0.26%, and the S&P 500 was +0.31%. It was a decent day and we thank God for that.
Stock futures are little changed as Wall Street awaits labor data and more earnings: Live updates
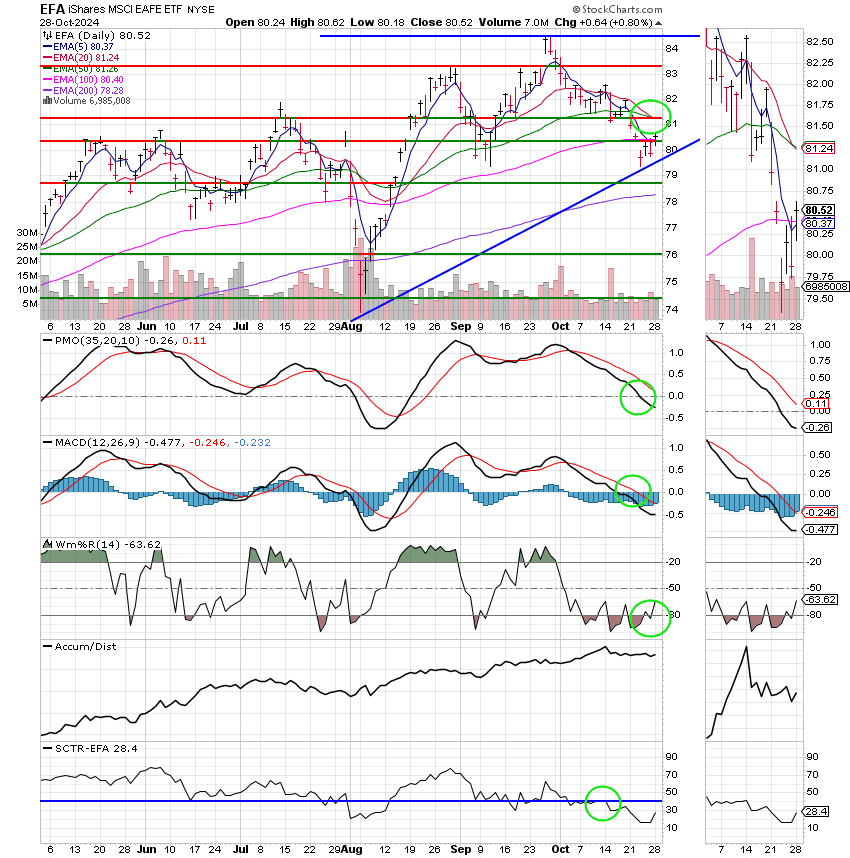
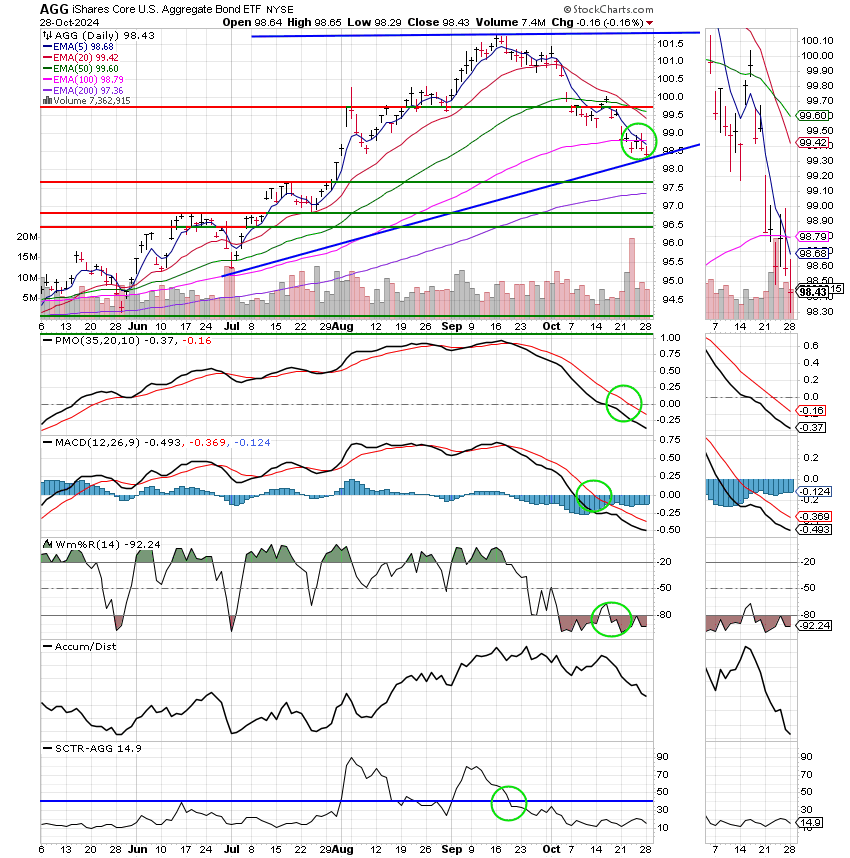
The days action left us with the following signals: C-Hold, S-Hold, I-Sell, F-Sell. We are currently invested at 100/C. Our allocation is now +11.45% not including the days results. Here are the latest posted results:
| 10/25/24 | Prior Prices | ||||
| Fund | G Fund | F Fund | C Fund | S Fund | I Fund |
| Price | 18.607 | 19.6274 | 91.5386 | 86.7344 | 43.6447 |
| $ Change | 0.0020 | -0.0361 | -0.0266 | -0.3770 | -0.1326 |
| % Change day | +0.01% | -0.18% | -0.03% | -0.43% | -0.30% |
| % Change week | +0.07% | -0.92% | -0.96% | -2.40% | -2.39% |
| % Change month | +0.27% | -2.31% | +0.86% | +0.73% | -4.02% |
| % Change year | +3.59% | +2.11% | +23.09% | +12.50% | +8.62% |


