Good Evening, Well we’re now post election. How many of you are glad that is all over? I certainly am. The market has been surging since last Tuesday. There are two things it likes. The biggest one is that a great deal of uncertainty has been removed from the market. Investors know how to approach things now. Certainty is almost always the biggest issue when considering the state of the market. The second thing is that the market obviously likes the Trump victory. Whether you like it or not, the market views his policies as market and business friendly moving forward. I know I know…..half the nation is in mourning. Well half the nation was in morning four years ago too. We survived then and we’ll survive now. So let’s move on and make some money. That’s something all our families can use. Shortly before the election our charts showed a surge in the S Fund. While we wanted to move a week or two earlier than we did we were forced to wait until the 1st business day in November as we were out of trades in October. The S fund has been moving higher for three reasons. The first is that we are in a falling rate environment. As of last Thursday the Fed has now cut the rate three times. Small cap businesses are extremely rate sensitive. They benefit the most from lower rates. Secondly, Trump administrations policies are expected to be small business friendly. So that is being priced in and finally there is seasonality. Small caps almost always outperform in November and December. Given these facts with the charts to back them up our move to the S Fund was a no brainer.
Now how about those charts. Let talk about the Volatility Index better known as the VIX first. It is measure of well…….. market volatility. I have used it as a red light green light sort of indicators for years. The lower it is the less volatile things are. The higher it is the more volatile the market is. The first thing you need to look at with the VIX is whether it is moving up or down. The second thing you need to look at is the level. So let me give you the VIX according to Scott. 16 and below is wide open risk off. Load up on stocks and let her rip. 16- 20 is buy if the VIX is trending lower and Hold and be vigilant if it is moving higher. 20-28 is the sell area if the VIX is trending higher and start to buy if it’s moving lower. Although, I honestly would have to have a really really good chart if I were to buy it with the VIX over 25. When it’s 28 and above, consider selling everything. Definitely go defensive, this is borderline bear territory. If I haven’t already sold everything then this is the point where I’m probably going to do so. Above 32, is bear market territory. It the VIX is above 32 you absolutely don’t want to be in stocks period! On the other had if the VIX is moving lower and breaks down through 28, this is a clear signal to pay close attention to your charts and get your buy list ready. Again, and pay attention, the most important thing to consider is whether it is trending higher or lower. That determines what you do when it enters a specific level. One more thing about this. You always make your decision to buy or sell based on your individual charts. For example if you been holding a stock for a long time and the VIX crosses 20 moving higher and your chart is close to a full on sell signal you’ll probably want to take some profit if not sell the stock altogether. Think of it like this and it’s easy to understand. Below 16 is a green light. Think of 16-20 as a green light turning yellow. 20-28 as a yellow light turning red and above 32 as a red light. So what is the VIX now? It is 14.97 and trending lower. Buy, Buy Buy! We’re moving higher!!!! Here is the chart:
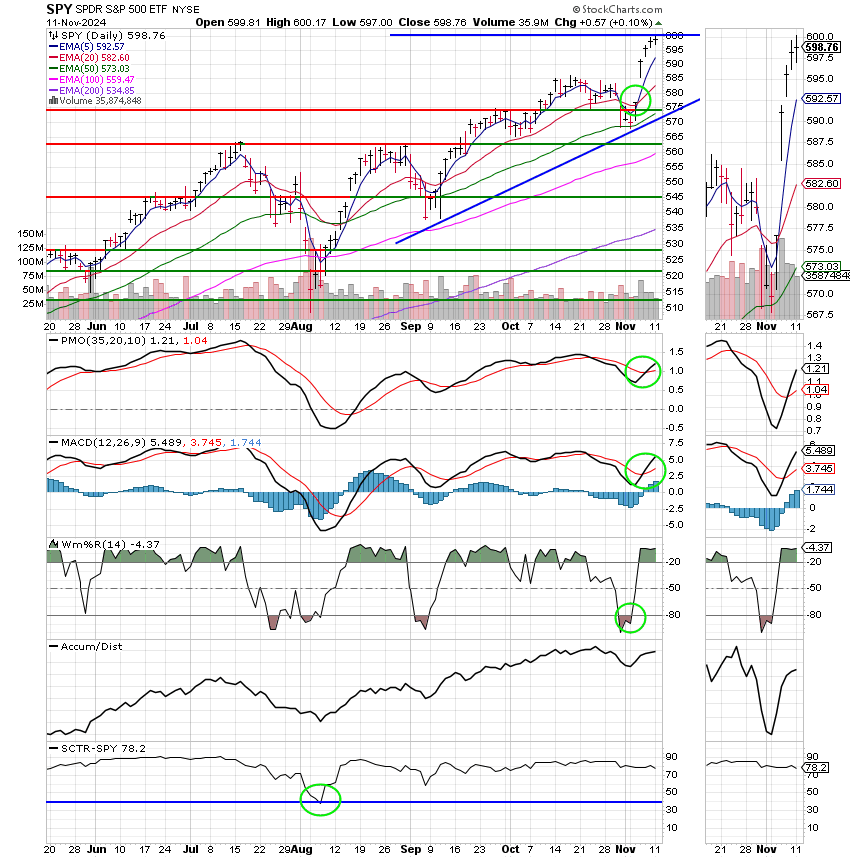
C Fund: The C Fund executed a bullish wedge pattern at 585 and is possibly forming a new at 598. The PMO and MACD are both in positive configurations passing up through their signal lines. The Williams %R is overbought a -4.37. This can work itself out with a pullback or by simply moving sideways. This one is primarily used as an overbought/ oversold indicator and can help you look for a short term top or bottom. The Accumulation distribution line shows that shares of this chart are being accumulated as it is moving toward the top right of the pane. That is what you want to see. The SCTR is 78.2. Anything above 40 is considered buyable in our system. While 78.2 is respectable it is not as strong as the S Fund SCTR of 92.8. Think of it as a grade of C verses a grade of A. That is the reason we are invested in the S Fund……
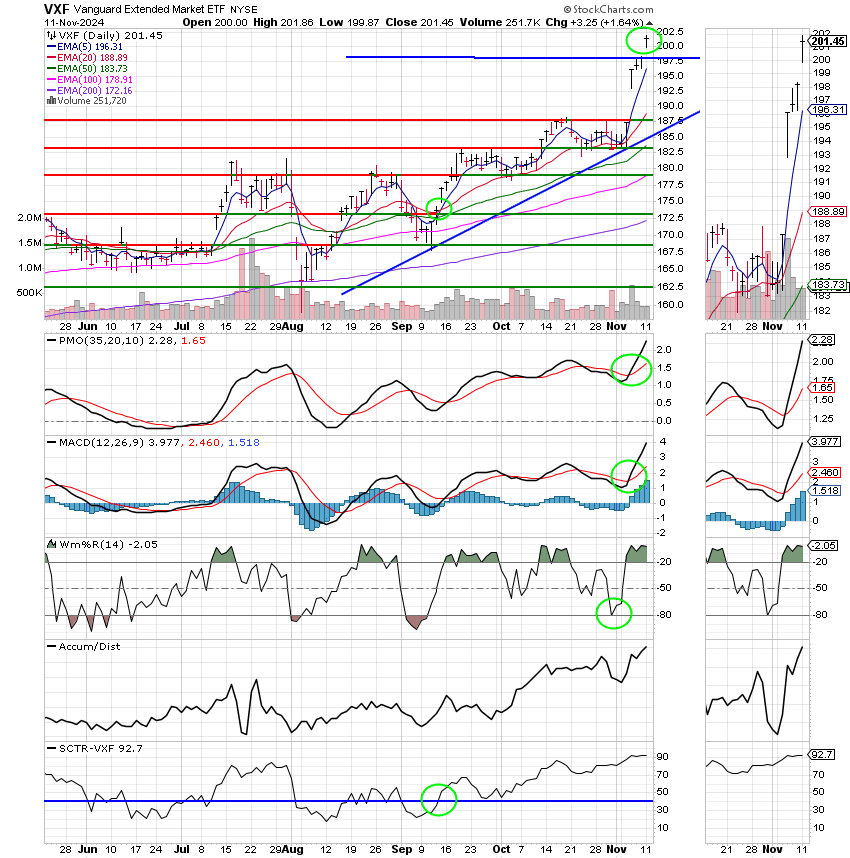
S Fund: Oh yeah! This is the chart. First off you can see where the latest wedge pattern executed at the top. As with the C Fund the PMO and MACD indicators are in positive configurations and the WM%R is reading overbought. The Accumulation /Distribution line is even more bullish than that of the C Fund moving into the top right hand corner or the pane at a solid 45% angle. Folks, the are buying this one. That indicator just doesn’t get more bullish than that. Finally, there is the SCTR which has moved higher to 92.7. You want to own any stock or fund that is above 90. That means it’s as good as or better than 92.7% of the other charts in it’s universe. It’s a pretty sure bet to make money!!
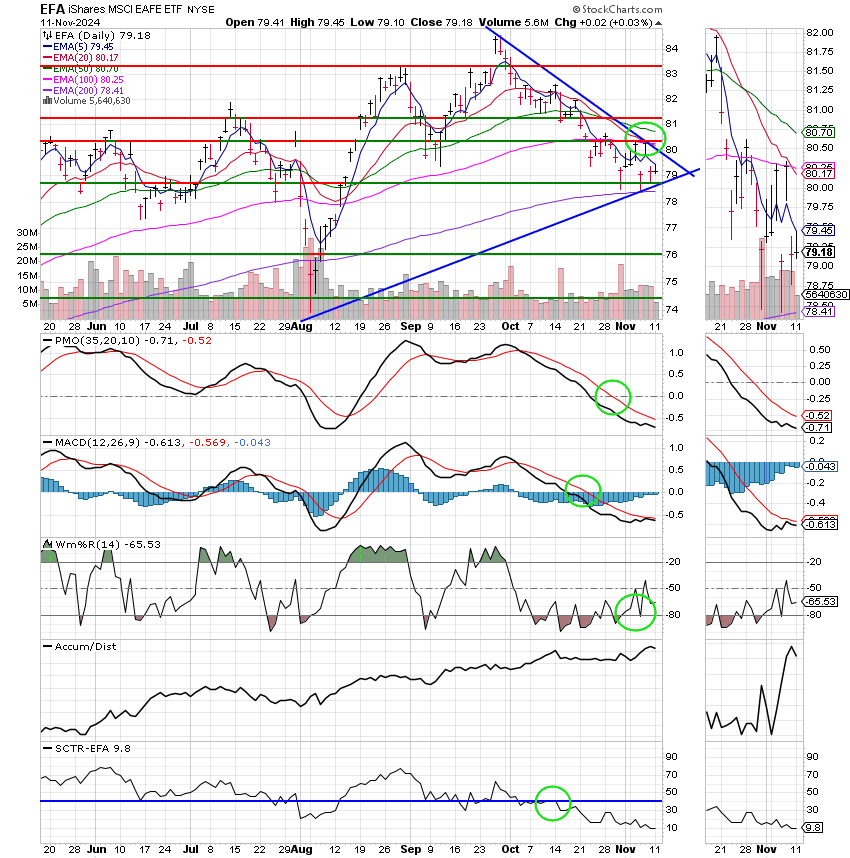
I Fund: This is a weak chart… The 20 EMA has passed down through the 100 EMA which means this chart is in a pretty good downtrend. That is reflected by the PMO and MACD being in negative configurations. I will also add that both of these indicators are well below their zero axis which if bearish. The WMs%R is pretty oversold at -65.53. 80 is the Extreme for that. The A/C line does shoe that shares are being accumulated. The thing about this indicator is that you will often see it reflected in price in coming days and weeks. So it is telling us that this ETF will eventually rise. Finally, there is the SCTR. It is currently sitting at 9.8. That’s about as weak as a chart can get. As a rule we don’t buy anything below 40. Ever!
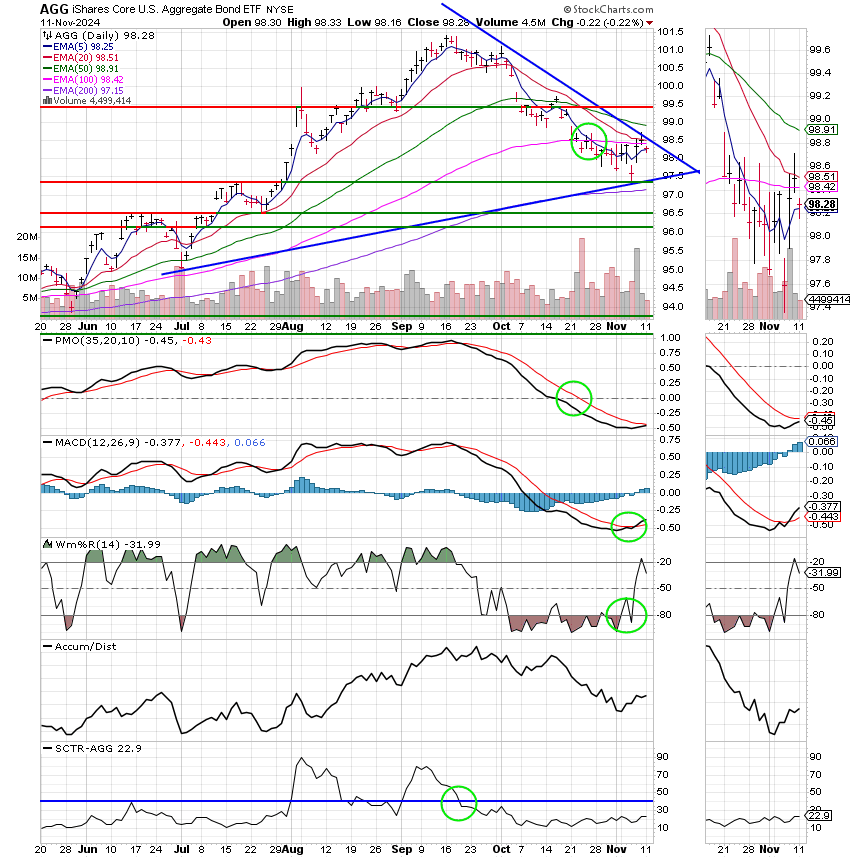
F Fund: Finally we have our bond chart. This one has been a sell but is starting to improve ever so slightly with price trading back above it’s 100EMA and the MACD moving back into a positive configuration passing up through its signal line. The Willams%R reflects the recent buying as it very close oversold territory. The A/C line isn’t showing a lot of buying and the SCTR is weak at just 22.6. This chart has a lot of work to go.
The days trading left us with the following results: Our TSP allotment had a strong day posting a gain of +1.64%. For comparison, the Dow added +0.66%, the Nasdaq =0.06%, and the S&P 500 +0.10%. Praise God for a wonderful day for a group!
Dow jumps 300 points to close above 44,000 for the first time as Trump enthusiasm continues
Recent action has left us with the following signals: C-Buy, S-Buy, I-Sell, F-Hold. We are currently invested at 100/S. Our allocation is now +18.53% on the year not including the days results. Here are the latest posted results:
| 11/08/24 | Prior Prices | ||||
| Fund | G Fund | F Fund | C Fund | S Fund | I Fund |
| Price | 18.6365 | 19.6594 | 94.5314 | 93.7551 | 43.4457 |
| $ Change | 0.0022 | 0.0378 | 0.3737 | 0.6482 | -0.4256 |
| % Change day | +0.01% | +0.19% | +0.40% | +0.70% | -0.97% |
| % Change week | +0.08% | +0.79% | +4.69% | +7.81% | +0.30% |
| % Change month | +0.09% | +0.34% | +5.12% | +8.25% | +0.75% |
| % Change year | +3.75% | +2.27% | +27.12% | +21.61% | +8.12% |
Well all I can say is praise God again! Our system is working well. While it won’t show in the yearly results as we spent most of the first half of the year getting acclimated to the new system, we have done about as well as anybody over the last 3 months or so and there is now reason to believe we won’t continue to do so. That’s all for this week. Have a great evening and may God continue to bless your trades.


